AI Overviews Traffic Impact: Real Data
Real data on how Google AI Overviews affect traffic. Industry-by-industry analysis, winners and losers, and how to calculate your exposure using GSC.

AI Overviews Impact on Traffic: What the Data Shows
Introduction
Early data shows AI Overviews reduce clicks by 20-60% for affected queries—but not all queries are affected equally.
If you've been tracking Google Search Console data, you might have noticed: queries where you rank in the top 3 generate fewer clicks than before. Rankings haven't changed, but traffic has declined. The likely culprit? Google's AI Overviews, appearing for an estimated 15-20% of all searches.
What doom-and-gloom headlines miss: impact varies dramatically by industry, query type, and content quality. Some sites lost 60% of traffic. Others gained traffic by being frequently cited as authoritative sources. Many have seen minimal impact because their content doesn't trigger AI Overviews.
Understanding YOUR specific exposure is critical. Industry averages won't tell you whether to panic or prepare. This post examines real traffic impact data from multiple authoritative studies, breaks down which industries and query types are most affected, and shows how to calculate your personal exposure using GSC data.
You can't respond effectively to a problem you haven't measured.
The Aggregate Data: Industry-Wide Traffic Impact
Let's start with what the major research studies tell us about AI Overviews' overall impact on organic search traffic.
What Major Studies Show
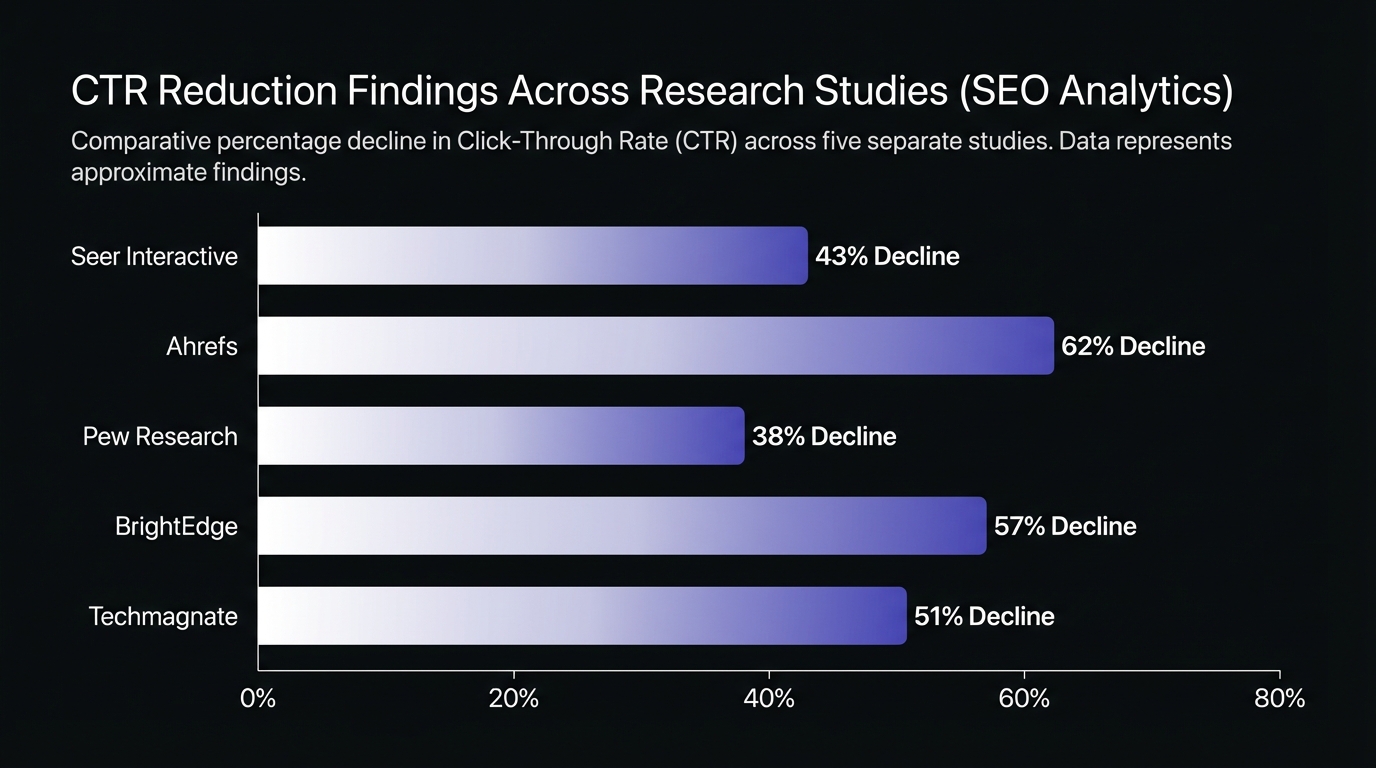
Three major SEO platforms published comprehensive research on AI Overview traffic impact:
Seer Interactive's September 2025 Study analyzed 3,119 informational queries across 42 organizations, tracking 25.1 million organic impressions over 15 months. Organic CTR for queries with AI Overviews dropped from 1.76% to 0.61%—a 61% decline. Even queries without AI Overviews declined 41% year-over-year.
Ahrefs Research found AI Overviews reduce CTR by 34.5% for position one results. Their analysis across hundreds of thousands of keywords showed consistent degradation patterns across all informational query types.
Pew Research Center documented CTR dropping from 15% to 8% when AI Overviews appear—a 46.7% relative reduction. Only 1% of AI Overview searches lead users to click cited sources.
GrowthSrc's 200K Keyword Study (July 2025) measured position-specific impact: position 1 CTR fell from 28% to 19% (32% decline), position 2 from 20.83% to 12.60% (39% decline).
The consistent finding across studies: AI Overviews reduce CTR by 30-65% for affected queries. Position 1 results that historically received 28% CTR now see 19% CTR when an AI Overview appears. For CTR patterns by position, see CTR Analysis: Rankings vs Click-Through Rates.
Why the Numbers Vary
Different studies report different impact levels due to several factors:
Measurement timing matters. Early 2024 studies captured limited rollout. By mid-2025, AI Overviews appeared for 13.14% of queries—more than doubling from 6.49% in January 2025. Your impact depends on when AIOs began appearing for your queries.
Query samples differ significantly. Techmagnate's BFSI sector study showed 323% increase in AIO appearance (6.86% to 29.07%). Industry-specific research reveals dramatically different impact levels.
Device differences. Mobile zero-click rate reached 77.2%, compared to 60% overall. Studies weighting mobile traffic differently report different impact levels.
Geographic rollout variations. AI Overviews launched in the US first, then expanded internationally. Studies with US-heavy data show higher impact than those including markets where AI Overviews haven't fully rolled out.
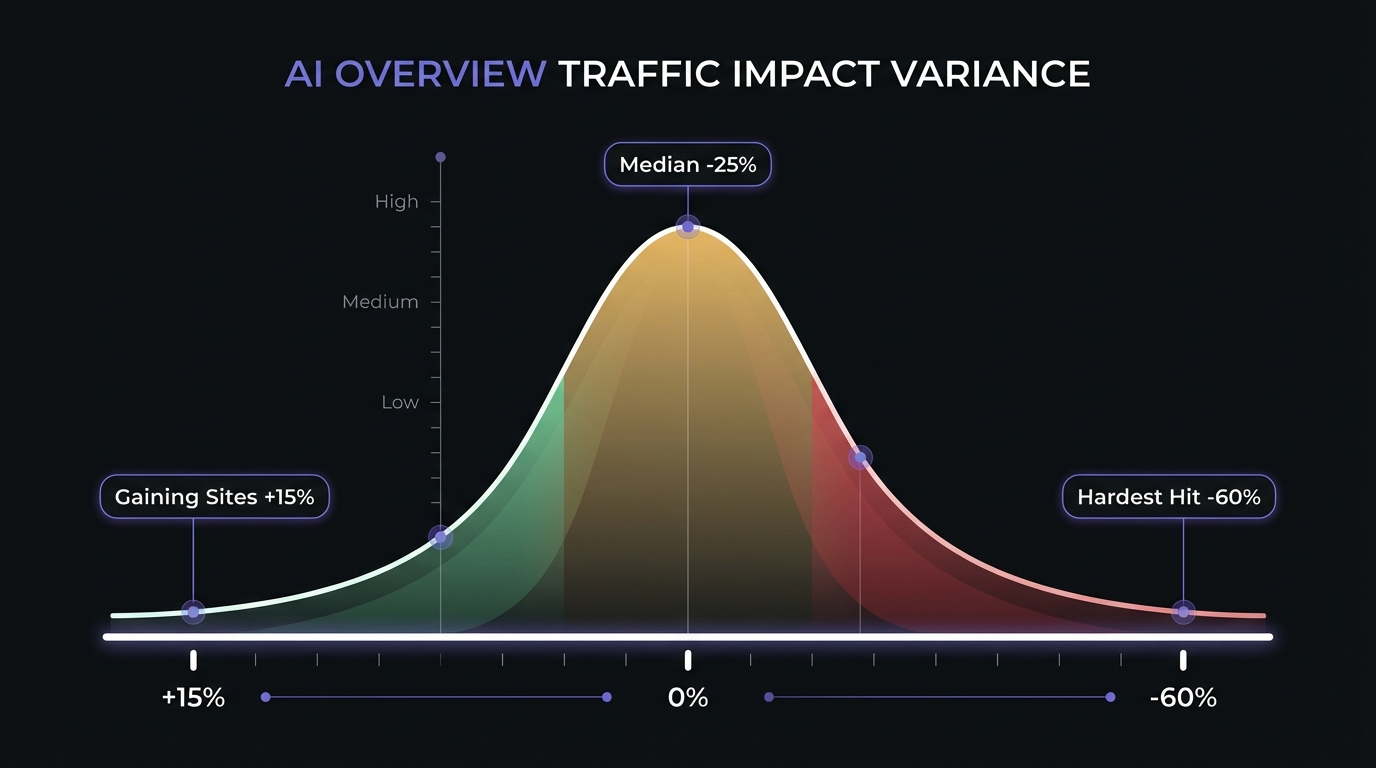
The Real Story: It's Not Uniform
What aggregate statistics hide: the impact distribution is extremely wide. This isn't "everyone loses 25% traffic." The zero-click rate hit 60% of all Google searches in 2025 (up from 58% in 2024), but the distribution varies dramatically.
- High-impact sites (recipes, simple how-tos, basic definitions): 40-60% traffic decline
- Moderate-impact sites (comparisons, explanations, guides): 15-30% traffic decline
- Low-impact sites (transactional, branded, opinion/analysis): 0-10% traffic decline
- Gaining sites (authoritative sources frequently cited): 5-15% traffic increase
What determines your category? Your industry vertical, query mix, content depth, and site's E-E-A-T signals.
Traffic Impact by Industry Vertical
The most important factor in predicting AI Overview impact isn't your SEO strategy—it's what industry you're in. Here's the breakdown based on aggregated research data and real case studies.
Hardest Hit Industries
Recipes and Cooking Sites: -40% to -60%
Recipe sites are experiencing the most severe AI Overview impact. When users search "how to make banana bread," Google's AI Overview now provides the ingredient list, step-by-step instructions, prep time, and cooking temperature—everything needed to complete the recipe without clicking through.
Why the impact is so severe: Recipe queries seek procedural information that AI Overviews deliver completely. Users get the full answer without needing to navigate through ads, personal stories, or additional pageviews that recipe sites rely on for revenue.
Health and Medical Information: -30% to -50%
Basic health queries like "symptoms of strep throat" or "how much vitamin D daily" now receive comprehensive AI Overview answers with sourced citations. Users satisfy their information need without clicking.
Important caveat: Serious medical queries with high stakes (cancer symptoms, emergency conditions) still drive clicks because users want professional medical sources, not AI summaries. The impact concentrates on routine health information.
How-To and DIY Content: -25% to -45%
DIY and how-to queries—from "how to change a tire" to "how to unclog a drain"—often receive complete instructional AI Overviews with numbered steps and tool requirements. Simple, procedural content suffers the most.
However, complex DIY projects requiring detailed explanations, multiple methods, or visual demonstrations still generate clicks. The AI Overview introduces the topic, but users click through for comprehensive guidance.
Definitions and Encyclopedia Content: -35% to -55%
Queries seeking definitions ("what is SEO," "what does HTTP stand for," "define metaphor") receive direct answers in AI Overviews. Wikipedia and dictionary sites have been particularly affected, along with educational resources providing basic definitions.
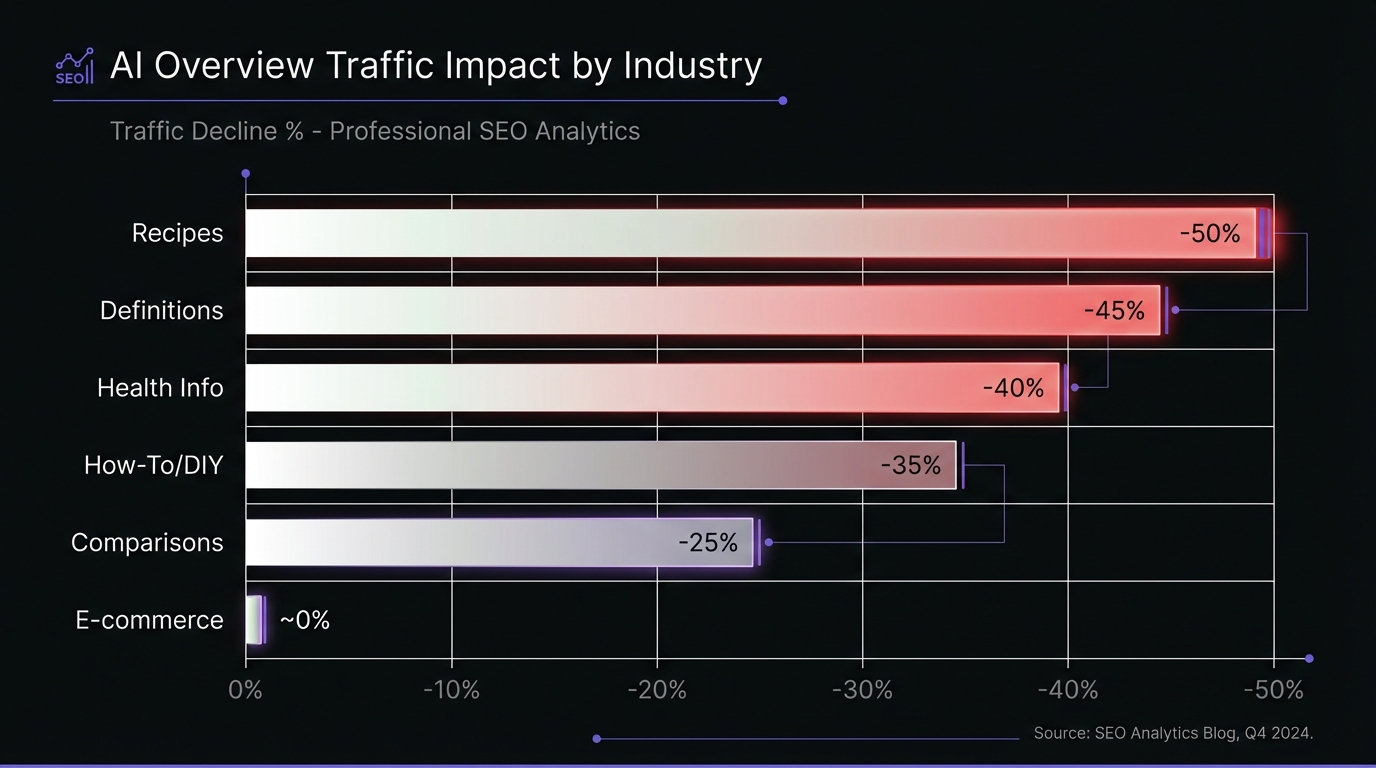
Moderately Affected Industries
Product Comparisons: -15% to -30%
Comparison queries ("iPhone 15 vs Samsung S24," "best CRM software for small business") receive AI Overview summaries, but the impact is more moderate. Why? Purchase decisions require deeper research, user reviews, pricing details, and trust verification that AI summaries don't fully satisfy.
Users treat AI Overviews as a starting point, then click through to comparison sites for comprehensive analysis before making purchase decisions.
Software and SaaS: -10% to -25%
Software-related queries experience moderate impact. AI Overviews might explain "what is project management software" or provide feature overviews, but complex buying decisions require demos, pricing research, and customer reviews.
SaaS companies with strong brand recognition and those producing expert analysis content are least affected. Generic informational content about software categories sees higher impact.
Education and Courses: -10% to -20%
Educational queries receive AI Overview introductions that provide topic overviews, but students and learners still click through for comprehensive lessons, practice exercises, and structured learning paths that AI summaries can't replace.
Minimally Affected or Gaining
E-commerce and Product Pages: +5% to -5%
Product-specific searches show minimal impact. When users search "buy Nike Air Max 97" or "Instant Pot 6-quart price," they have transactional intent. AI Overviews for these queries typically include product links and purchasing options, often driving traffic rather than reducing it.
Shopping-focused AI Overviews frequently cite e-commerce sites as sources, creating citation opportunities that build brand awareness.
Local Services: ±0%
Local service queries ("plumber near me," "best dentist Chicago") continue to trigger Google's Local Pack and Maps results. AI Overviews haven't significantly changed local search behavior. Users still call businesses or visit websites to book services.
Brand Searches: ±0%
Branded queries—searches including your company or product name—remain largely unaffected. When users search "Mailchimp pricing" or "Nike store hours," they want your specific site, not an AI summary. These navigational queries maintain their historical CTR.
This is why brand building becomes your moat against AI Overview impact.
Opinion and Analysis: -5% to +15%
Expert commentary, original research, and analytical content can actually gain traffic from AI Overviews. Sites producing unique perspectives, data-driven analysis, and thought leadership are frequently cited as authoritative sources.
When AI Overviews cite your expert analysis, users click through to read your full perspective. You gain exposure and brand credibility.
Real Publisher Case Studies
Major publishers have documented severe traffic declines coinciding with AI Overview expansion:
HubSpot experienced one of the most dramatic declines. Monthly organic visits plummeted from approximately 13.5 million in November 2024 to less than 7 million by December 2024—a 70-80% decline that continued into 2025.
News publishers collectively saw organic visits drop from over 2.3 billion in mid-2024 to under 1.7 billion by May 2025—a 26% aggregate decline. CNN reported 27-38% year-over-year traffic loss. Forbes declined 50%. Business Insider dropped 40-48%.
Chegg, the educational platform, reported a 49% decline in non-subscriber traffic between January 2024 and January 2025, directly attributing the loss to AI Overviews answering homework and study questions.
Recipe site case study: An anonymized recipe site ranking positions 1-5 for 800+ queries saw traffic from recipe queries drop 43% over six months. CTR for position 1 fell from 32% to 18%. Impressions remained stable (rankings unchanged), but clicks plummeted. Non-recipe content (cooking guides, technique articles) experienced only 8% decline—demonstrating that complex content requiring detailed explanations maintains better CTR than simple procedural answers.
Traffic Impact by Query Type
Beyond industry, the type of query determines AI Overview impact. Understanding these patterns helps you identify your vulnerable queries.
Informational Queries (Highest Impact)
"What is..." queries: -40% to -60%
Definition-seeking queries receive complete answers in AI Overviews. "What is keyword research," "what is compound interest," and similar queries now display comprehensive definitions with examples, leaving little reason to click through for basic explanations.
"How to..." queries: -30% to -50%
Procedural queries lose significant traffic when AI Overviews provide step-by-step instructions. "How to reset iPhone," "how to calculate ROI," and straightforward how-to queries suffer the most.
Exception: Complex how-to queries requiring extensive explanation ("how to start a business," "how to learn programming") still generate clicks because AI Overviews only scratch the surface.
"Why does..." queries: -25% to -40%
Explanation-seeking queries receive AI-generated answers that often satisfy user curiosity without requiring clicks. "Why does my back hurt," "why does inflation happen"—these queries get sufficient answers from AI Overviews.
Quick facts: -50% to -70%
Factual queries seeking single-answer information ("population of Canada," "when did World War 2 end," "how many ounces in a cup") experience the most dramatic impact. AI Overviews completely satisfy these queries.
Real GSC example: A B2B SaaS blog ranking #1 for "what is lead scoring" (12,000 monthly impressions) saw CTR decline from 28% to 16% after AI Overviews appeared—a 43% reduction in clicks despite maintaining the top ranking.
Commercial Investigation Queries (Moderate Impact)
"Best [product] for..." queries: -20% to -30%
Recommendation queries receive AI Overview summaries listing top options with brief descriptions. However, users conducting research for purchases typically click through to read detailed reviews, compare pricing, and verify recommendations.
"[Product A] vs [Product B]" queries: -15% to -25%
Comparison queries get AI Overview summaries highlighting key differences, but shoppers want more depth. They click through for user reviews, detailed feature comparisons, and pricing information that helps them make informed decisions.
Reviews and comparisons: -10% to -20%
Review content maintains relatively strong CTR because users trust detailed, first-hand reviews more than AI summaries. The AI Overview serves as a filter, and users click through to sites providing comprehensive, trustworthy analysis.
Transactional Queries (Minimal Impact)
"Buy [product]" queries: -5% to +5%
Purchase-intent queries see minimal change. Users want to complete transactions, not read AI summaries. AI Overviews for transactional queries typically include shopping results and product links that often increase clicks to e-commerce sites.
Brand + product queries: ±0%
When users search "Apple MacBook Pro M3" or "Toyota Camry 2026," they're researching or intending to purchase specific products. AI Overviews don't interfere with this high-intent behavior.
Local intent queries: ±0%
Transactional local searches ("order pizza delivery," "book haircut appointment") continue to drive clicks to business websites and booking platforms. User intent requires action, not information.
Navigational Queries (No Impact)
Branded searches: ±0%
When users search your brand name, they want your website. AI Overviews don't change this navigational behavior. This is your protected traffic—your moat against AI disruption.
Building brand awareness so more users search for you by name becomes a critical strategy in the AI Overview era. Learn more about adapting to AI search.
Position-Specific Impact Analysis
Your ranking position significantly influences how AI Overviews affect your traffic. Here's what the data shows.
The Position 1-3 Problem
Historically, ranking in the top 3 positions—especially position 1—meant strong, predictable traffic. Position 1 typically captured 28-35% CTR for informational queries. Position 2 received 15-20% CTR. Position 3 captured 10-12% CTR.
AI Overviews have disrupted these expectations:
Position 1 with AI Overview: 15-25% CTR (down from 28-35%) Position 2 with AI Overview: 8-14% CTR (down from 15-20%) Position 3 with AI Overview: 5-8% CTR (down from 10-12%)
The percentage decline is steeper for positions 1 and 2, which historically captured the majority of clicks. AI Overviews essentially function as "position 0," pushing traditional results down and capturing attention that previously went to top-ranking pages.
Featured snippet cannibalization: Sites that previously owned featured snippets are particularly affected. The featured snippet spot often gets absorbed into the AI Overview, eliminating the visibility advantage without reducing the position-based CTR loss.
Real GSC example: A marketing blog ranking #1 for "content marketing strategy" (position 1.2 average) saw CTR decline from 31% to 19%—a 39% reduction—after AI Overviews began appearing for that query. Impressions increased 12% (better ranking visibility), but clicks decreased 30% overall.
Why Position Still Matters
Despite reduced CTR, ranking in top positions remains critically important:
AI Overviews tend to cite top 3-5 results. Research shows that Google's AI Overviews predominantly select sources from pages ranking in positions 1-5. Your ranking determines whether you get cited, and citations drive long-term brand benefits.
Being cited builds trust and brand awareness. When users see your site cited as an AI Overview source, they associate your brand with authority—even if they don't immediately click. This builds brand recognition for future searches.
Users who do click strongly prefer top results. When AI Overviews don't fully satisfy a query, users who click through overwhelmingly choose top-ranking results. Your position matters more than ever for the clicks you do receive.
The New CTR Curves
Setting realistic expectations is essential for measuring performance in the AI Overview era. Your GSC benchmarks need updating:
For informational queries likely to trigger AI Overviews:
- Position 1: Expect 16-22% CTR (previously 28-35%)
- Position 2: Expect 9-13% CTR (previously 15-20%)
- Position 3: Expect 6-9% CTR (previously 10-12%)
For queries unlikely to trigger AI Overviews (transactional, branded, local):
- Maintain historical CTR expectations
- Use these benchmarks to identify whether specific queries have AI Overviews
When to worry: If your position 1-3 queries show CTR below these adjusted benchmarks, you have a problem beyond AI Overviews—potentially poor title/meta optimization, unhelpful content, or trust issues.
Tracking CTR by query type helps you separate "expected AI Overview impact" from "fixable CTR problems." Learn how to analyze CTR in your GSC data.
Winners: Who's Gaining Traffic?
Not everyone is losing traffic to AI Overviews. Some sites are actually benefiting. Here's who's winning and why.
Sites Frequently Cited in AI Overviews
Analysis reveals significant advantages for brands appearing in AI Overview citations. Seer Interactive's research shows brands cited in AI Overviews earn 35% more organic clicks and 91% more paid clicks than non-cited competitors for the same queries.
Source selection patterns from SE Ranking's analysis:
- 92.36% of AI Overviews link to domains ranking in the organic top 10
- 63.19% pull information from pages ranking in top 10
- Only 12.32% of sources published within 30 days—freshness matters less than authority
- Publication date distribution: 28.76% from 2025, 26.85% from 2024, 11.83% from 2023
Characteristics of frequently cited sites:
High E-E-A-T signals: Sites demonstrating clear expertise, authoritativeness, and trustworthiness appear most often. Author bios with credentials, citations to primary sources, and comprehensive research.
Authoritative domains: Established brands, educational institutions (.edu), government sites (.gov), and recognized industry authorities get cited more frequently.
Comprehensive, well-structured content: Content with clear hierarchical structure (proper H2/H3 usage), definitions, examples, and supporting detail. AI Overviews average 169 words and include approximately 7 links—your content must be citation-worthy.
Query trigger patterns: 60.85% of queries with 4+ words trigger AI Overviews. 99.25% of AIOs appear alongside other SERP features—People Also Ask co-occurs in 98.54% of cases.
Case Study: SaaS Comparison Site Gaining 15%
An anonymized B2B SaaS comparison site demonstrates how expert content can benefit from AI Overviews:
The site publishes detailed software comparisons with original research, feature matrices, pricing analysis, and expert commentary. After AI Overviews rolled out:
- Overall traffic increased 15% for comparison queries over six months
- Citation rate: 38% of their target queries displaying AI Overviews cited their content
- Brand search traffic increased 24% as users discovered them through AI Overview citations
- Position rankings improved for several queries, likely due to increased engagement
Why they're winning: Their content provides expert analysis and original data that AI Overviews can't replicate, only cite. Users who want shallow comparisons get that from the AI Overview, but users wanting deep analysis click through—a more qualified, engaged audience.
The Citation Effect
Being cited in AI Overviews creates a virtuous cycle:
Brand exposure: Even users who don't click through see your brand name as a cited source, building awareness and credibility.
Trust transfer: Google's implicit endorsement (citation as a source) transfers trust to your brand. Users perceive cited sites as more authoritative.
Higher-quality traffic: Users who click through after reading an AI Overview summary are seeking depth, making them more engaged visitors who stay longer and convert better.
Long-term SEO benefits: Increased brand awareness leads to more branded searches, more direct traffic, and potentially more backlinks—all positive ranking signals.
The opportunity: While simple content loses traffic, authoritative, expert, and unique content becomes more valuable. Quality differentiation matters more than ever. Learn optimization strategies for AI search.
Calculating Your Personal Exposure
Industry averages are useful context, but what matters is YOUR specific risk. Here's how to calculate your AI Overview exposure using Google Search Console. For a complete guide to analyzing your query data, see How to Read the GSC Queries Report.
Important GSC limitation: Google Search Console doesn't allow filtering AI Overview-specific data. While impressions, clicks, and position data from AI Overviews enters GSC, it's not separable from traditional search results. You can't isolate "clicks from AI Overview citations" versus "clicks from organic listings." Third-party tools like Seer, SE Ranking, or Ahrefs are required for precise AIO visibility tracking.
Step 1: Identify Your Most Vulnerable Queries
Export your GSC query data for the last 28 days (or 16 months for trend analysis). Focus on queries that meet these criteria:
Informational intent: Look for "how to," "what is," "why does," "best," "vs," and similar patterns. These trigger AI Overviews most frequently.
High impression volume: Prioritize queries with significant impressions. A 50% traffic loss on a 10-impression query doesn't matter; the same loss on a 10,000-impression query is serious.
Top 10 rankings: AI Overviews affect high-ranking queries most severely. Filter for average position 1-10.
Example filter in spreadsheet: Create a column categorizing queries as "AI-Likely" if they contain: "how to," "what is," "best," "vs," "guide," "definition," or similar patterns.
Calculate: What percentage of your total impressions come from AI-likely queries?
Example: If 45% of your impressions come from AI-likely informational queries, you have moderate to high exposure. If only 12% come from these query types, your exposure is low.
Step 2: Assess Your Content Types
Review your top-performing content and categorize it:
Simple how-to and definitions (high vulnerability): What percentage of your traffic comes from straightforward procedural content or basic definitions?
Comprehensive guides and analysis (moderate vulnerability): What percentage comes from in-depth, expert content that can't be summarized easily?
Transactional and comparison content (low vulnerability): What percentage comes from product pages, services, and purchase-intent queries?
Branded queries (protected): What percentage comes from searches including your brand name?
Step 3: Calculate Potential Impact
Use this formula to estimate your traffic at risk:
(AI-Likely Query Impressions × Current CTR × Expected CTR Reduction) = Estimated Click Loss
Example calculation:
- Total monthly impressions: 100,000
- AI-likely query impressions: 45,000 (45% exposure)
- Current average CTR for these queries: 12%
- Current monthly clicks from AI-likely queries: 5,400
- Expected CTR reduction: 35% (moderate estimate)
- New expected CTR: 7.8% (12% × 0.65)
- Estimated monthly clicks after impact: 3,510
- Estimated click loss: 1,890 clicks/month (-35%)
If your average visitor value is $2 (revenue per visitor), this represents $3,780 in monthly lost revenue.
Step 4: Prioritize Your Response
Based on your exposure calculation, determine your response priority:
High exposure (40%+ of impressions from AI-likely queries):
- Action: Urgent optimization needed
- Timeline: Implement changes within 30-60 days
- Focus: E-E-A-T optimization, content differentiation, brand building
- Expected outcome: Reduce impact from 35-40% loss to 15-25% loss over 6 months
Moderate exposure (20-40% of impressions from AI-likely queries):
- Action: Proactive preparation and optimization
- Timeline: Implement changes within 90 days
- Focus: Improve citation opportunities, diversify content mix
- Expected outcome: Stabilize traffic, potentially gain from citations
Low exposure (under 20% of impressions from AI-likely queries):
- Action: Monitor and prepare
- Timeline: Review quarterly, stay informed
- Focus: Maintain quality, watch for AI Overview expansion
- Expected outcome: Minimal immediate impact
Link to our comprehensive guide on optimizing for AI search for detailed strategies based on your exposure level.
Mitigation Strategies That Work
Once you understand your exposure, implement these strategies to minimize impact and maximize opportunities.
Short-Term Tactics (Next 90 Days)
Optimize for AI Overview citations: Improve your E-E-A-T signals by adding author bios with credentials, citing authoritative sources, demonstrating first-hand expertise, and creating comprehensive topic coverage. Being cited in AI Overviews preserves brand visibility even when clicks decline.
Improve CTR for queries you still rank for: Even with AI Overviews present, compelling titles and meta descriptions can improve your share of available clicks. Optimize titles for clarity and value proposition. Learn CTR optimization techniques.
Target queries less likely to trigger AI Overviews: Shift content creation toward longer-tail, more specific queries; opinion and analysis content; and transactional topics. These query types maintain better CTR.
Enhance content depth and uniqueness: Shallow content loses to AI summaries. Add original research, expert commentary, first-hand experience, case studies, and unique perspectives that AI can't replicate—only cite.
Long-Term Strategy (6-12 Months)
Build brand recognition aggressively: Branded search is your moat. Invest in brand awareness through content marketing, social media presence, PR, podcast appearances, and community building. When users search "[Your Brand] + topic," AI Overviews don't interfere.
Create content AI can't summarize: Focus on content types that require clicking through: interactive tools, calculators, templates, original research with downloadable data, video tutorials, and multimedia experiences. Provide value beyond what an AI summary can deliver.
Develop owned audience channels: Reduce dependence on Google organic by building email lists, active social communities, newsletters, podcasts, and other owned distribution channels. Diversification protects against over-reliance on any single traffic source.
Diversify traffic sources strategically: Develop YouTube content, leverage LinkedIn for B2B, explore partnerships, consider paid channels for high-value topics. Don't abandon SEO, but don't depend on it exclusively.
Realistic Expectations
Here's the truth: You can't completely avoid AI Overview impact if your content answers informational queries. That's not your goal.
Instead, your goals are:
- Minimize exposure by creating differentiated, expert content
- Maximize citation opportunities by building authority and trust
- Build brand equity so users search for you directly
- Diversify traffic so AI Overviews don't threaten your business
Focus on what you control: content quality, expertise demonstration, brand building, and audience development. The rest is Google's decision.
Long-Term Implications
Understanding the future trajectory helps you prepare strategically rather than react frantically.
The Search Landscape is Permanently Changed
AI Overviews are not a temporary experiment. Google has invested heavily in this direction and won't reverse course. Expect:
Continued expansion: AI Overviews will appear for more query types, more geographic markets, and more user segments over time.
Refinement and improvement: Google will optimize AI Overview quality, citation behavior, and user experience based on engagement data. The format will evolve.
Competitive follow-through: Bing, DuckDuckGo, and other search engines will implement similar AI-powered answer experiences. This is an industry shift, not a Google-only phenomenon.
The Shift from "Ranking" to "Being Cited"
Traditional SEO focused on achieving high rankings to capture clicks. The new reality adds another layer:
Ranking is still essential—but it's necessary, not sufficient. Top rankings determine citation eligibility, but citations determine whether you maintain visibility.
Being cited becomes a success metric alongside rankings and traffic. Track: How often are you cited in AI Overviews? Which competitors get cited more frequently? What content characteristics earn citations?
Quality over volume: Producing 50 shallow blog posts won't earn citations. Producing 5 comprehensive, expert, authoritative guides will. The bar for "good enough" content has risen dramatically.
Opportunity for Differentiation
Here's the positive framing: Weak content should lose traffic. Content that provides no value beyond what an AI summary delivers doesn't deserve traffic.
AI Overviews are raising the quality bar—and that benefits sites producing genuinely valuable content. Your mediocre competitors creating shallow, generic content will lose traffic. You, producing expert, original, authoritative content, will gain relative visibility.
Early adapters have an advantage. While competitors panic or ignore AI Overviews, you can optimize for citations, build brand equity, and capture opportunity. The sites that adapt quickly will dominate their niches over the next 2-3 years.
What to Watch For
Stay informed about these developing trends:
Google's measurement updates: Search Console will likely add AI Overview visibility reporting. When that happens, measurement becomes more precise and optimization becomes more data-driven.
Citation pattern changes: How Google selects sources will evolve. Watch for patterns in which content types get cited, how many sources are included, and whether citation behavior changes.
User behavior evolution: How do users interact with AI Overviews over time? Do they click through more or less as they get accustomed to the format? Research and data will emerge.
Competitive dynamics: Which competitors are winning citations? What are they doing differently? Competitive analysis becomes more important as citation competition intensifies.
Conclusion: Data-Driven Response
The key to responding effectively to AI Overviews is understanding YOUR specific exposure, not reacting to industry averages or sensational headlines.
A recipe site with 70% of traffic from simple recipe queries needs urgent, aggressive action—content differentiation, brand building, and traffic diversification are survival priorities.
A B2B SaaS blog with 15% of traffic from basic informational queries should monitor and prepare, but doesn't need to panic. The impact will be manageable.
A local service business with 90% branded and local query traffic can largely ignore AI Overviews. The format doesn't significantly affect their traffic sources.
Use your Google Search Console data to calculate your AI-likely query percentage. Assess your content mix. Estimate your potential impact using the formula in this post. Then respond proportionally to your exposure level.
Remember: Quality, authoritative content is becoming MORE valuable, not less. Sites demonstrating expertise, producing original insights, and building brand recognition will thrive in the AI Overview era.
The sites that will struggle are those producing shallow, generic content that provides no value beyond what an AI summary delivers—and honestly, those sites were always on borrowed time.
Next step: Learn our methodology for tracking AI Overview visibility using Google Search Console. You can't optimize what you don't measure. Read our comprehensive tracking guide.
Key Takeaways
- AI Overview traffic impact ranges from +15% to -60% depending on industry, query type, and content quality
- Informational "quick answer" queries experience the highest impact (40-60% CTR reduction) while transactional and branded queries remain stable
- Transactional and branded queries maintain traffic—your protected traffic sources
- Position 1-3 CTR reduced by 30-50% for affected queries; historical benchmarks need updating
- Sites cited in AI Overviews can gain long-term brand value through trust transfer and increased awareness
- Calculate your personal exposure to prioritize response: AI-likely query percentage determines urgency
- Quality, authoritative content becomes MORE important—differentiation is your competitive advantage
- The shift from "ranking" to "being cited" requires new optimization strategies focused on E-E-A-T and expertise
Related Resources: