GSC Pages Report: Find Top & Low Performers
Analyze your GSC Pages Report to find star performers and diagnose underperformers. Build a prioritization framework that maximizes SEO ROI with page-level analysis.

Pages Report Analysis: Identifying Your Best and Worst Performers
Last Updated: January 23, 2026
Your Pages Report shows exactly which content drives organic success and which pages hold you back. Most people glance at top pages and move on. The real insights lie in systematic page-level analysis.
This guide covers analyzing your Pages Report to find star performers, diagnose underperformers, and build a prioritization framework that maximizes SEO ROI.
Why Page-Level Analysis Matters
Your site is a collection of individual pages, each competing for rankings. Page-level analysis reveals patterns aggregate data masks:
- Resource allocation: Top 10 pages often drive 60-80% of traffic
- Content gaps: High impressions + low clicks = ranks but doesn't satisfy intent
- Quick wins: Pages ranking positions 5-10 offer low-hanging fruit
- ROI prioritization: A pricing page click may be worth 10x a blog post click
Page-level analysis connects SEO work to business outcomes—specific pages driving specific results.
Accessing and Understanding Your Pages Report
Navigate to Performance > Search Results, then click Pages below the chart.
What You're Looking At
The report displays:
- URL: Full page path
- Clicks: Users who clicked from search
- Impressions: Times the page appeared in results
- CTR: Click-through rate (clicks ÷ impressions)
- Position: Average ranking across all queries
Default sort is by clicks descending.
Date Range Considerations
Use these ranges:
- Last 3 months: Current performance snapshot
- Last 6 months: Trends and seasonal patterns
- Last 12 months: Annual review, year-over-year comparison
- Comparison mode: Spot growth, decline, or stagnation
Avoid periods under 28 days—short timeframes amplify noise.
2026 GSC Features for Page Analysis
Recent GSC updates make page analysis more accessible:
AI-powered configuration: Describe the analysis you want in natural language, and GSC automatically applies filters, comparisons, and metric selections. Ask for "pages with high impressions but low CTR" instead of manually configuring filters.
Custom annotations: Add notes directly to performance charts, tying traffic changes to real-world actions. When you update a page's title, annotate it—you'll remember what happened and when during future reviews.
Weekly and monthly views: December 2025 introduced weekly and monthly aggregation, making it easier to spot trends without daily noise.
Identifying Your Best Performers
Best-performing pages are your SEO foundation. Understand what makes them successful to replicate elsewhere.
The Top 10 Analysis
Export your top 10 pages by clicks. For each, document:
- Total clicks and impressions: Your visibility and conversion metrics
- CTR: How compelling your result is compared to competitors
- Average position: Your typical ranking
- Primary queries: Click into each page to see which queries drive traffic
- Content type: Blog post, product page, category page, tool, etc.
- Business value: How this page contributes to revenue or goals
What Makes a Page a "Best Performer"
High-performing pages share these characteristics:
Strong topical relevance: Comprehensive coverage of a specific topic aligned with search intent.
High-quality backlinks: External links Google interprets as trust signals. Check your Links Report for top-linked pages.
Excellent user experience: Fast loading, mobile-friendly, clear navigation, good visual design.
Strategic internal linking: Strong internal link structures with relevant contextual links.
Search intent alignment: Content format and depth matches user expectations—guides for informational queries, product details for transactional.
The 80/20 Rule in Action
Typically, 20% of pages drive 80% of organic traffic. Understand this distribution for better resource allocation.
Calculate your split:
- Export all pages data
- Sort by clicks descending
- Sum total clicks
- Count pages to reach 80% of total
If 15 pages drive 80% of traffic from a 500-page site, focus there. A 10% improvement on those 15 pages outperforms a 100% improvement on your bottom 100.
Identifying Your Worst Performers
Underperformers fall into categories requiring different strategies.
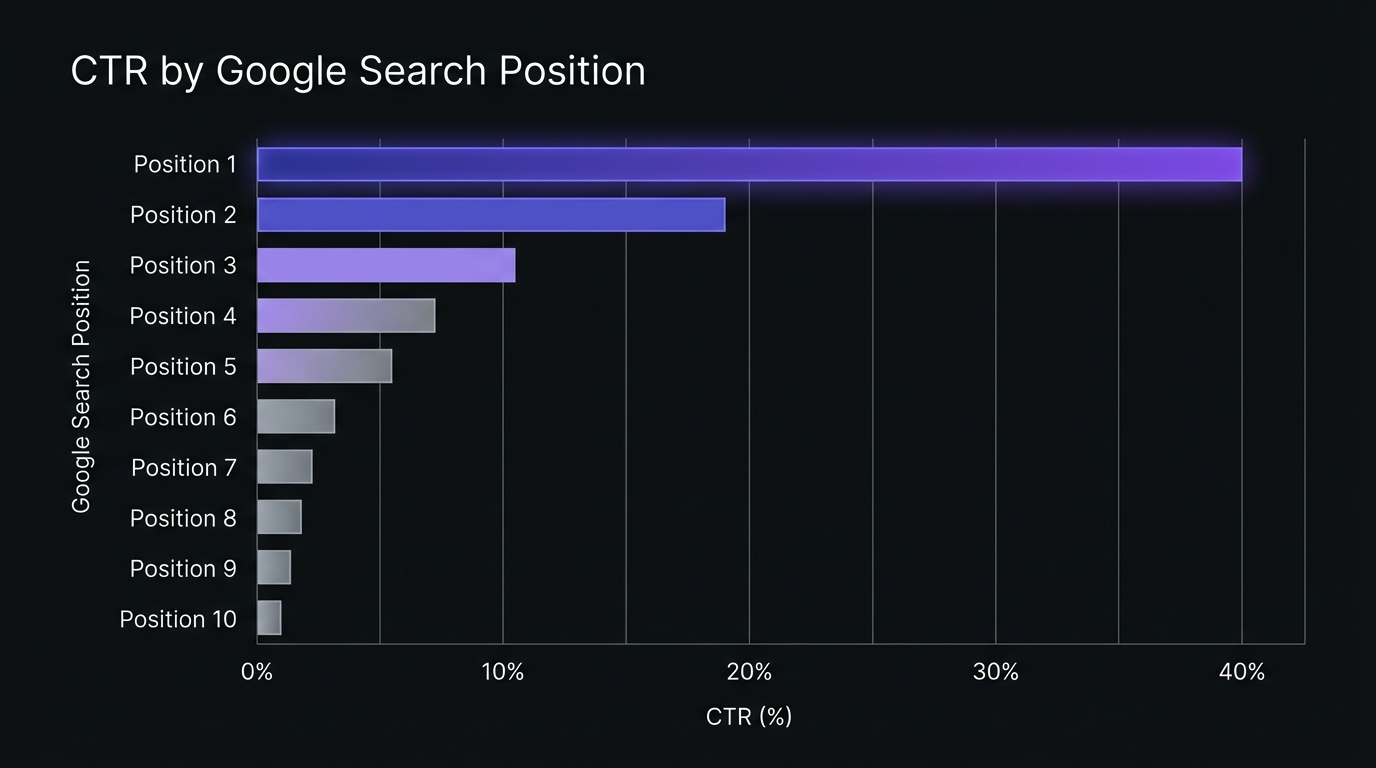
CTR Benchmarks by Position
Before diagnosing CTR problems, understand expected click-through rates by position. 2026 benchmark data shows:
| Position | Expected CTR | Notes |
|---|---|---|
| 1 | 39.8% | With AI Overview: 38.9% |
| 2 | 18.7% | Sharp drop from position 1 |
| 3 | 10.2% | |
| 4 | 7.2% | |
| 5 | 5.1% | |
| 6-10 | 4.4% → 1.6% | Rapidly diminishing returns |
AI Overview Impact (2025-2026): Position 1 CTR dropped from 28% to 19% (32% decline) when AI Overviews appear. AI Overviews now show on approximately 31% of search results. Getting cited in an AI Overview yields 35% more organic clicks than not being cited.
Industry variations: CTR varies significantly by vertical. Education queries see position 1 CTR around 45%, while some categories like Pets drop to 16%. Use these benchmarks as starting points, not absolutes.
Category 1: High Impressions, Low Clicks (CTR Problem)
Symptoms:
- Thousands of impressions, minimal clicks
- CTR significantly below position benchmarks above
- Position 1-10 but not getting clicked
What's happening: Page ranks but users find competitors more compelling.
Diagnosis:
- Title tag compelling and relevant?
- Meta description create urgency or value?
- Competitors using rich results (FAQ, How-To)?
- URL convey relevance and trust?
- AI Overview capturing clicks for this query?
Category 2: High Impressions, Low Position (Ranking Problem)
Symptoms:
- Thousands of impressions, position 15-30+
- CTR under 1%
- Minimal clicks relative to impressions
What's happening: Ranks for relevant queries but not high enough—page 2 or 3.
Diagnosis:
- Content comprehensive vs page 1 results?
- Sufficient backlinks to compete?
- Content fresh and recently updated?
- Targeting right search intent?
- Higher-ranking pages have rich results, video, or SERP features you lack?
Category 3: Low Impressions, Low Everything (Visibility Problem)
Symptoms:
- Under 100 impressions/month
- Almost no clicks
- Position >30 or not ranking for target queries
What's happening: Google doesn't view page as relevant or authoritative. May lack clear target.
Diagnosis:
- What queries should this page rank for?
- Page actually target those queries?
- Page indexed? (Check Index Coverage or URL Inspection)
- Sufficient internal links?
- Content thin or duplicate?
- Page provide unique value?
Category 4: Declining Performance (Trend Problem)
Symptoms:
- Previously strong, now declining
- Month-over-month or year-over-year drops
- May or may not show impression/position drops
What's happening: Content decay, competition, algorithm changes, or technical issues eroding performance.
Use comparison mode:
- Select date range (last 3 months)
- Click "Compare," select previous period
- Sort by clicks difference for biggest decliners
- Analyze if decline is all queries or specific ones
Category 5: Zero-Click Pages (SERP Feature Problem)
Symptoms:
- Good impressions and position
- CTR under 1% despite top rankings
- Often informational queries ("what is," "how many")
What's happening: Google answers directly via featured snippet, People Also Ask, or knowledge panel.
Options:
- Capture the featured snippet yourself
- Target queries with higher click-through potential
- Add transactional or deeper content to encourage clicks
- Accept brand visibility without clicks
The Page Performance Matrix: Prioritization Framework
Not all underperformers deserve equal attention. Use this matrix to prioritize.
The 4-Quadrant Matrix
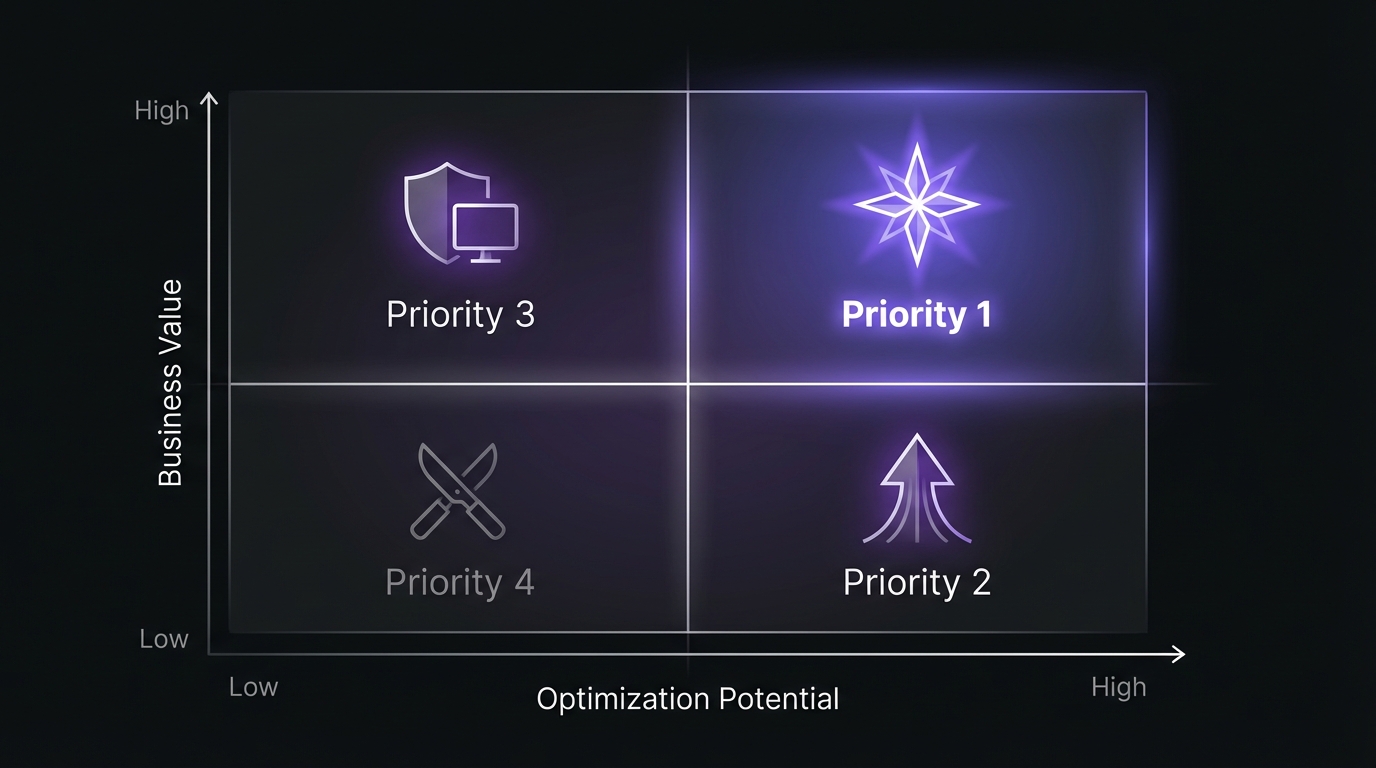
Quadrant 1: High Value, High Potential (Priority 1)
Pages: Important business pages (pricing, products, high-converting content) ranking positions 5-15
Action: Immediate optimization—combines business impact with realistic improvement potential.
Tactics:
- Content expansion and update
- Title/meta optimization
- Strategic internal linking
- Schema markup
- Backlink building
Expected ROI: High. Small position improvements yield significant gains.
Quadrant 2: High Value, Low Potential (Priority 3)
Pages: Important pages performing excellently (positions 1-3) or extremely poorly (>30)
Action:
- High performers: Monitor and maintain
- Very low performers: Complete content overhaul or replacement
Tactics:
- High performers: Content freshness, defend backlinks, monitor competitors
- Low performers: Major rewrite, restructure, or de-index and consolidate
Expected ROI: Medium. High performers have limited upside; low performers require massive effort.
Quadrant 3: Low Value, High Potential (Priority 2)
Pages: Blog content, informational pages, low-conversion pages ranking positions 5-15
Action: Selective optimization for significant traffic volume despite lower conversion value.
Tactics:
- Quick wins: Title/meta, internal linking
- Content refreshes vs full rewrites
- Batch similar pages
- Testing ground for high-value page tactics
Expected ROI: Medium. Lower per-click value but easier wins.
Quadrant 4: Low Value, Low Potential (Priority 4)
Pages: Low-value content ranking poorly with little improvement potential
Action: Minimal investment. Prune, consolidate, or ignore.
Tactics:
- Evaluate for deletion (thin, outdated, duplicate)
- Consolidate multiple pages into one
- Noindex to focus crawl budget
- Accept not every page needs to perform
Expected ROI: Very low. Resources better spent elsewhere.
Detailed Page Analysis: Going Deeper
Dig deeper into priority pages.
Analyzing Individual Page Performance
Click any URL to see:
Query breakdown: Which queries drive traffic. Reveals:
- Primary topic focus (queries aligned with page intent?)
- Search intent mix (informational vs commercial vs navigational)
- Keyword opportunities (queries ranking positions 5-15)
- Irrelevant rankings
The Query-Page Alignment Check
For each priority page:
Do top queries match the page's primary purpose? Product page ranking for "how to" queries = intent mismatch.
Ranking for unexpected queries? Reveals:
- Content opportunities to expand
- Unintended keyword cannibalization
- Gaps in keyword targeting
High-volume queries ranking low? Sort by impressions, then position. High-impression queries in positions 5-20 are best optimization targets.
Multi-Page Pattern Analysis
Look for patterns across similar pages:
Content type performance:
- How-to guides vs listicles?
- Comparison vs review pages CTR?
- Which formats have best position-to-CTR ratio?
Template or technical issues:
- Similar CTR problems in one section? (Template-level title/meta issues)
- Subdomain underperformance? (Technical SEO issues)
- Newer pages outperform older? (Content decay signal)
Topical authority:
- Which topics show strong multi-page performance?
- Weak performance despite multiple pages? (Insufficient authority or competition)
Page Segmentation Strategies
Segment analysis for clearer insights.
Segmentation by Content Type
Blog posts vs product pages vs category pages:
- Different types have different benchmarks
- Comparison pages typically have higher CTR than guides
- Product pages prioritize commercial queries; blogs dominate informational
Segmentation by Funnel Stage
Awareness (informational):
- Expect: High impressions, moderate CTR, informational queries
- Metrics: Traffic volume, time on site, scroll depth
Consideration (comparison, guides):
- Expect: Moderate impressions, higher CTR, commercial investigation queries
- Metrics: Pages per session, email/trial conversion
Decision (product, pricing, demo):
- Expect: Lower impressions, high CTR, commercial transaction queries
- Metrics: Conversion rate, revenue per visit
Different stages require different approaches. Consideration pages with low CTR need better title persuasion. Awareness pages with low impressions need more content and backlinks.
Segmentation by Business Priority
Tier 1: Revenue-driving (product, pricing, high-converting) Tier 2: Lead-generation (email capture, tools, key resources) Tier 3: Authority-building (guides, research, thought leadership) Tier 4: Supporting (supplementary blogs, FAQs)
Favor Tier 1-2 in optimization budget.
Common Page Performance Patterns and What They Mean
Pattern 1: The Declining Homepage
Symptoms: Homepage shows declining clicks and impressions.
Causes:
- Brand search declining (broader business problem)
- Internal linking pushing other pages above homepage
- Homepage not optimized for non-brand queries
- Thin or generic content
Solution: Homepages aren't primary organic traffic sources. If brand search declines, investigate brand health and marketing effectiveness.
Pattern 2: The Underperforming Pillar Page
Symptoms: Pillar/guide page has fewer clicks than supporting cluster posts.
Causes:
- Pillar targets head terms with intense competition
- Clusters target easier long-tail queries
- Pillar too broad, doesn't satisfy specific intent
- Insufficient internal linking from clusters
Solution: Often normal. Pillars build authority; clusters drive traffic. Ensure strong cluster-to-pillar linking.
Pattern 3: The CTR Anomaly
Symptoms: Dramatically higher or lower CTR vs similar pages at similar positions.
High CTR: Excellent title/meta, brand recognition, rich results, numbers in title
Low CTR: Generic titles, missing meta descriptions, competitors have rich results, untrustworthy URL
Solution: Document and replicate high CTR. For low CTR, test titles or implement schema.
Pattern 4: The Seasonal Spike Pages
Symptoms: Dramatic seasonal traffic patterns (3x+ variation).
Causes: Seasonal topics, holiday content, school year patterns, weather queries
Solution: Use year-over-year comparison. Prepare seasonal content 2-3 months in advance. Create evergreen supplements.
Pattern 5: The Cannibalization Cluster
Symptoms: Multiple pages split impressions/clicks for same queries, all ranking positions 5-20.
Causes: Multiple pages targeting same keyword, similar content, unclear relevance to Google
Solution: Consolidate pages, redirect to one primary, or differentiate to target distinct intents. See Identifying Keyword Cannibalization Using GSC Data.
Building Your Page Optimization Workflow
Turn insights into results.
Step 1: Create Your Priority List (15 minutes)
Export Pages Report and score:
Opportunity Score = (Impressions × Business Value) × (1 + Improvement Potential)
- Impressions: Raw count from GSC
- Business Value: 1-10 scale (conversion value/importance)
- Improvement Potential:
- Position 5-10 = 3 (high)
- Position 11-20 = 2 (moderate)
- Position 1-4 = 1 (limited)
- Position 20+ = 0.5 (low)
Sort by Opportunity Score descending. Top 10-20 = next quarter's priorities.
Step 2: Diagnose Each Priority Page (10 minutes per page)
For each page in your priority list:
- Click into the page in GSC to see its query breakdown
- Identify the top 5-10 queries by impressions
- Note average position for each query
- Google each query and analyze the top-ranking results:
- What content format do they use?
- How comprehensive is the content?
- What rich results appear?
- What is their title/meta strategy?
- Identify the gap: What do top results have that yours doesn't?
Step 3: Create Page-Specific Action Plans
Based on your diagnosis, assign tactics:
For CTR problems (ranking well, not getting clicks):
- Rewrite title tag with emotional trigger or number
- Add year to title for freshness signal ("2026 Guide")
- Write compelling meta description with call-to-action
- Implement FAQ or How-To schema for rich results
- Improve URL structure if overly long or unclear
For ranking problems (high impressions, low position):
- Expand content to match top-ranking page depth
- Add sections addressing related queries (see People Also Ask)
- Update content with fresh examples, data, screenshots
- Build strategic internal links from related high-authority pages
- Create external link-building campaign
- Improve E-E-A-T signals (author bio, citations, expertise demonstration)
For visibility problems (low impressions):
- Ensure page is indexed (URL Inspection tool)
- Confirm target keywords are in title, H1, first paragraph
- Add internal links from related pages with contextual anchor text
- Evaluate if topic has search demand (use keyword research tools)
- Consider consolidating with related pages if topic is too narrow
- Check for technical issues (slow loading, mobile problems)
Step 4: Batch Similar Optimizations
Don't optimize one page at a time. Batch similar work:
Title/meta optimization batch: Spend 2-3 hours rewriting titles and meta descriptions for 20-30 pages with CTR issues.
Internal linking batch: Identify 10 high-authority pages and add relevant internal links to 50+ lower-performing pages.
Schema markup batch: Implement FAQ or How-To schema across all relevant pages in one session.
Content refresh batch: Update statistics, screenshots, and examples across multiple pages published in the same timeframe.
Batching similar work is more efficient and helps you develop optimization templates.
Step 5: Track and Measure Results
Create a tracking spreadsheet with:
- Page URL
- Optimization date
- Pre-optimization metrics (clicks, impressions, CTR, position)
- Tactics implemented
- Post-optimization metrics (28, 60, 90 days later)
- Result (success/partial/failure)
Track changes over 28-day periods minimum. Many SEO changes take 2-4 weeks to show results. Compare 28 days post-optimization to the 28 days pre-optimization.
Advanced Page Analysis Techniques
Device-Specific Page Performance
In your Pages Report, add the Device filter to see how pages perform on mobile vs desktop.
Common patterns:
- Mobile CTR lower than desktop: Mobile UX issues, slow loading, or title truncation
- Mobile position worse than desktop: Google's mobile-first index penalizing mobile experience
- Tablet dramatically different: Often indicates responsive design issues
For pages with significant device discrepancies, run mobile usability tests and consider device-specific optimizations.
Geographic Page Performance
Add the Country filter to understand which pages perform in which markets.
Strategic insights:
- Pages performing well in non-target countries may indicate international expansion opportunities
- Pages with U.S. traffic might need localized versions for Canada, UK, Australia
- Local business pages should dominate in their geographic area
Search Appearance Analysis
If you have rich results (FAQ, How-To, Product schema), filter by Search Appearance to see performance lift.
Compare:
- Pages with rich results vs pages without
- CTR lift from rich results at similar positions
- Which rich result types deliver the best engagement
Use this data to prioritize schema implementation on pages where rich results provide the biggest competitive advantage.
Pages to Prune: When to Delete or Noindex
Not every page deserves to exist. Regular content pruning improves site quality and focuses crawl budget on pages that matter.
Pruning Thresholds
Use these GSC-based thresholds to identify pruning candidates:
| Metric | Threshold | Action |
|---|---|---|
| Impressions (6 months) | <100 | Review for pruning |
| Clicks (6 months) | <10 | Strong prune candidate |
| Average Position | >30 with no upward trend | Prune or major overhaul |
| Monthly visits (revenue pages) | <1,000 | Needs immediate attention |
Backlink check: Before pruning any page, verify it has no valuable backlinks. Pages with inbound links from authoritative sites should be improved or consolidated rather than deleted—you'll lose that link equity otherwise.
Content Action Decision Matrix
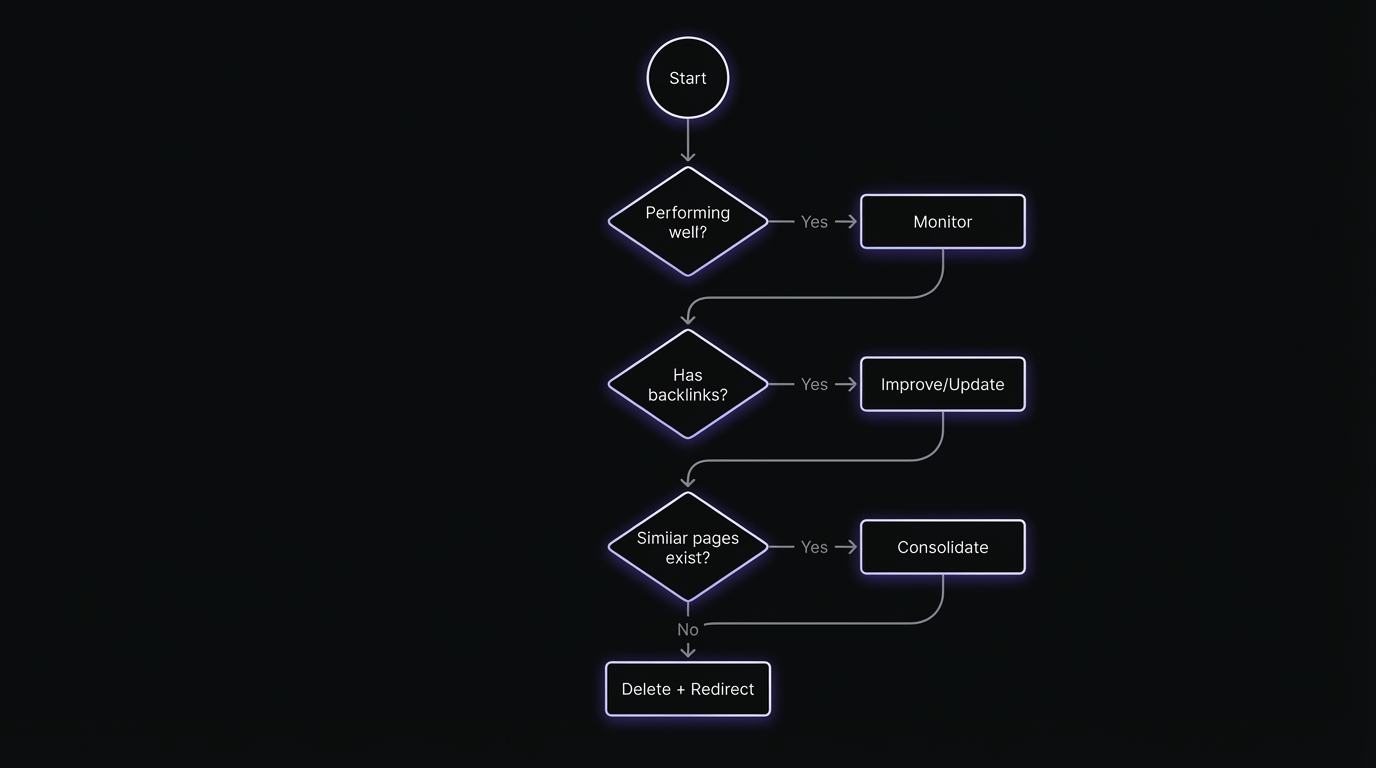
| Action | When to Use | Implementation |
|---|---|---|
| Leave | Strong rankings, converting well | Monitor quarterly |
| Improve | Relevant topic, outdated/thin content | Update content, refresh data |
| Consolidate | Multiple pages targeting same keywords | Merge into one, 301 redirect others |
| Deindex | Useful internally, not for search | Add noindex, keep live |
| Delete + Redirect | Irrelevant, no backlinks, no conversions | 301 to related page or 410 Gone |
Candidates for Removal
Thin content pages:
- Under 300 words with no unique value
- Created for SEO but never gained traction
- Fewer than 10 clicks in 6+ months despite impressions
Truly outdated content:
- Product pages for discontinued products (redirect to alternatives)
- Event pages for past events with no historical value
- Time-sensitive news or announcements no longer relevant
Duplicate or near-duplicate pages:
- Multiple pages targeting identical keywords without differentiation
- Copy-paste content across similar categories or locations
- Auto-generated pages with minimal customization
Technically problematic pages:
- Soft 404s that return 200 status but have no content
- Pages with permanent redirect chains
- Parameter-based URLs that create infinite variations
Pruning Process
- Export all pages with fewer than 100 impressions in last 6 months
- Review business value: Even low-traffic pages may have high conversion value
- Decide action:
- Delete + 410 Gone: For truly useless content
- Delete + 301 redirect: For outdated content with a logical successor
- Noindex + keep: For pages you need but don't want in search results
- Consolidate: Merge multiple weak pages into one strong page
- Monitor impact: Watch Index Coverage for changes, track overall site impressions
Done correctly, pruning can increase overall site authority by focusing Google's crawl budget on quality content.
Review Frequency
How often to audit your pages depends on site size:
- Large sites (10,000+ pages): Review every 1-3 months
- Medium sites (500-10,000 pages): Quarterly reviews
- Small sites (<500 pages): 1-2 times per year
Set calendar reminders. Pruning isn't a one-time project—it's ongoing maintenance.
Page-Level Analysis Mistakes to Avoid
Mistake 1: Only Looking at Clicks
Clicks are important, but they're not the whole story. A page with 100 clicks and position 15 (high potential) is a better optimization target than a page with 1,000 clicks and position 2 (limited upside).
Solution: Always consider impressions and position context.
Mistake 2: Comparing Apples to Oranges
Comparing blog post performance to product page performance is meaningless. They target different query types, different user intents, and different funnel stages.
Solution: Compare pages within the same content type and funnel stage.
Mistake 3: Over-Optimizing Top Performers
Your page ranking position 1-2 doesn't need aggressive optimization. It needs maintenance and protection.
Solution: Focus optimization energy on positions 5-15 where effort yields the highest ROI.
Mistake 4: Ignoring Query-Page Alignment
A page might get traffic, but if it's ranking for the wrong queries (informational when you want commercial), the traffic won't convert.
Solution: Click into high-traffic pages and review their query lists. Optimize for query alignment, not just traffic volume.
Mistake 5: Short-Term Thinking
Analyzing 7 or 14 days of page data is nearly useless due to volatility.
Solution: Use minimum 28-day periods, preferably 90 days. Use year-over-year comparison for seasonal content.
Mistake 6: Analysis Paralysis
You can spend infinite time analyzing data and never optimize a single page.
Solution: Set a time limit. Spend 2 hours analyzing, then 8 hours optimizing. Bias toward action.
Putting It All Together: Your 30-Day Page Optimization Plan
Here's a practical 30-day workflow to analyze and improve your page-level performance:
Week 1: Analysis and Prioritization
Day 1-2: Export and categorize
- Export Pages Report (last 90 days)
- Categorize by content type, funnel stage, business value
- Calculate Opportunity Scores
Day 3-4: Identify patterns
- Find your best and worst performers in each category
- Identify CTR outliers (both high and low)
- Document pages with declining performance (use comparison)
Day 5-7: Create action plan
- Select top 20 priority pages
- Diagnose each page (query analysis, competitive analysis)
- Assign specific optimization tactics
- Batch similar work together
Week 2-3: Optimization Execution
Batch 1: Quick wins (Days 8-10)
- Title and meta description rewrites (30-40 pages)
- Schema markup implementation (15-20 pages)
- Internal linking improvements (50+ new contextual links)
Batch 2: Content work (Days 11-17)
- Comprehensive content updates (top 10 priority pages)
- Add missing sections based on People Also Ask and competitor analysis
- Update screenshots, examples, statistics
- Improve formatting and readability
Batch 3: Technical (Days 18-21)
- Fix mobile usability issues on key pages
- Improve page speed on slow-loading pages
- Implement or fix canonical tags
- Address any indexing issues
Week 4: Monitoring and Documentation
Day 22-24: Set up tracking
- Create results tracking spreadsheet
- Document baseline metrics for all optimized pages
- Set calendar reminders for 28, 60, 90-day check-ins
Day 25-27: Content pruning
- Identify low-value pages for removal
- Implement 301 redirects or noindex directives
- Update internal links to point away from pruned pages
Day 28-30: Review and plan
- Document what you learned
- Note which tactics you'll prioritize next cycle
- Identify next 20 pages for optimization
- Calculate estimated ROI from current optimizations
Conclusion
Your Pages Report is actionable only if you move beyond surface-level analysis. Professional SEO means systematically analyzing page performance, prioritizing effectively, and executing optimizations that drive measurable results.
Key principles:
Focus on opportunity, not just performance: Position 8 with high business value beats position 2 with low business value.
Segment analysis: Different content types, funnel stages, and priorities require different strategies.
Batch work: Optimize 20-30 similar-issue pages per session. Work efficiently.
Measure and learn: Track optimizations over 28-90 days. Build your playbook from results.
Stay systematic: Use frameworks vs gut feel. Systematic = better ROI.
Next action: Open Pages Report. Export last 90 days. Identify top 3 pages with high impressions, positions 5-15, high business value. Analyze queries and competitors (30 min). Create optimization plans. Execute this week.
Best-performing sites systematically improve good pages, fix broken pages, prune useless pages. Your Pages Report shows where to focus.
Related Resources:
- How to Interpret GSC Click-Through Rate Data
- Position Tracking in GSC: What Average Position Really Means
- GSC Impressions vs Clicks: Reading the Gap
- Content Decay Signals: When to Update vs Consolidate vs Delete
- Identifying Keyword Cannibalization Using GSC Data
Ready to turn page-level insights into traffic growth? Download our free Page Optimization Tracking Spreadsheet to systematically track and measure your optimization results over time.
About the Author: [Author bio placeholder]
Last Updated: January 23, 2026