SEO Reporting: Turn Data Into Impact
Create SEO reports stakeholders actually read. Translate GSC data into business impact, tailor reports for different audiences, and connect traffic to revenue.

SEO Reporting for Stakeholders: Turn Data Into Business Impact (Templates Included)
Your CEO doesn't care that you moved from position 8 to position 5. But they do care that organic traffic drove $50K more revenue this month. That's the difference between SEO reports and business reports.
Most SEO professionals struggle with reporting not because they lack data, but because they're speaking the wrong language. They present technical metrics to executives who need business outcomes. They dump spreadsheets when stakeholders need stories. They track rankings when leadership cares about revenue.
The problem isn't the data. It's how you present it.
In this guide, you'll learn how to create SEO reports that stakeholders actually read and act on. You'll discover how to translate Google Search Console data into business impact, tailor reports for different audiences, and build narratives that connect organic performance to revenue outcomes. Whether you're reporting to C-suite executives or marketing teams, you'll get templates and frameworks that transform technical metrics into strategic insights.
Why Most SEO Reports Fail
Before we dive into what works, let's examine why so many SEO reports end up ignored, skimmed, or misunderstood.
The most common reporting mistake is the data dump: fifty metrics, seven charts, zero story. These reports assume stakeholders will connect the dots themselves. They won't. Without context and narrative, even the most impressive performance gains get lost in the noise.
Then there's the vanity metrics trap. "We published 20 blog posts this month!" sounds productive, but it's meaningless without business context. Did those posts drive traffic? Did that traffic convert? Without connecting outputs to outcomes, you're just reporting activity, not results.
Technical jargon creates another barrier. When you tell your CEO "our Domain Authority increased 3 points," you've lost them. Domain Authority isn't a Google metric, and even if they knew what it meant, they wouldn't know how it affects the bottom line. The same goes for talking about "improving our crawl budget" or "increasing our E-A-T signals." These concepts matter for SEO execution, but they're implementation details, not stakeholder communications.
Perhaps the most damaging mistake is disconnecting SEO metrics from business outcomes. Traffic increased 20%—great! But did revenue increase? Did you hit your lead generation goals? Are you on track for your quarterly targets? Stakeholders operate in a world of budgets, revenue targets, and return on investment. If you can't connect your SEO wins to those business realities, your work looks like an interesting side project rather than a strategic growth driver.
Finally, most SEO reports look backward only. They explain what happened but offer no perspective on what's next. Stakeholders don't just want to know that traffic grew 12% last month—they want to know if you'll hit your quarterly goal, what you're doing next month to maintain momentum, and whether you need any resources or decisions from them.
The Data Dump Problem
When faced with dozens of available metrics from Google Search Console, Google Analytics, and various SEO tools, the instinct is to include everything. More data feels more thorough, more professional, more impressive.
This backfires spectacularly.
Stakeholders have limited time and attention. When they open a report and see walls of numbers, their eyes glaze over. They might scan the first page, but by page three of density-packed tables and charts, they've stopped reading. The insights you carefully prepared for page five never get seen.
Even worse, data dumps create confusion. When everything is presented with equal weight, nothing stands out as important. Is the 5% increase in average position more significant than the 15% increase in impressions? Should they be concerned about the Core Web Vitals score, or excited about the new keyword rankings? Without hierarchy and context, stakeholders can't extract meaning.
Technical Metrics vs Business Outcomes
Here's the uncomfortable truth: most SEO metrics don't mean anything to business stakeholders.
Average search position? They don't know if 12 is good or bad, and they certainly don't know how it translates to business results. Click-through rate improved from 3.8% to 4.1%? Unless you explain what that means in terms of actual clicks and potential revenue, it's just a number.
The solution isn't to avoid technical metrics entirely—it's to connect them to business outcomes. Every metric you report should answer the question: "So what?" If you can't explain why a metric matters for business goals, don't include it.
Instead of: "We improved our average position from 12.3 to 9.7."
Try: "We improved our rankings for product keywords, which increased organic traffic to product pages by 2,500 clicks this month. Based on our 5% conversion rate, that's approximately 125 additional leads valued at $50K in potential pipeline."
The first statement is accurate but meaningless to non-SEO stakeholders. The second connects the technical win to business outcomes they care about: traffic, leads, and revenue.
SEO-to-Business Language Translation
One persistent barrier is vocabulary. Here's a reference for translating common SEO terms into business language:
| SEO Term | Business Translation |
|---|---|
| Algorithm update | Google search ranking changes |
| Organic traffic | Unpaid website visitors from search |
| Keyword rankings | Search result visibility |
| Impressions | Times your brand appeared in search |
| CTR (Click-through rate) | Search result click efficiency |
| Backlinks | External website endorsements |
| Domain Authority | Third-party brand strength estimate |
| Crawl budget | Google's site scanning capacity |
| Index coverage | Pages Google can show in results |
| Core Web Vitals | Page loading and usability scores |
Use business translations in stakeholder reports. Save SEO terminology for internal discussions with your SEO team.
Know Your Audience: Different Reports for Different Stakeholders
The biggest revelation in improving your SEO reporting is this: one report doesn't fit all stakeholders. Your CEO needs completely different information than your marketing team, and both need different information than your direct manager.
Effective reporting starts with understanding your audience—what they care about, what decisions they make, and how they'll use the information you provide.
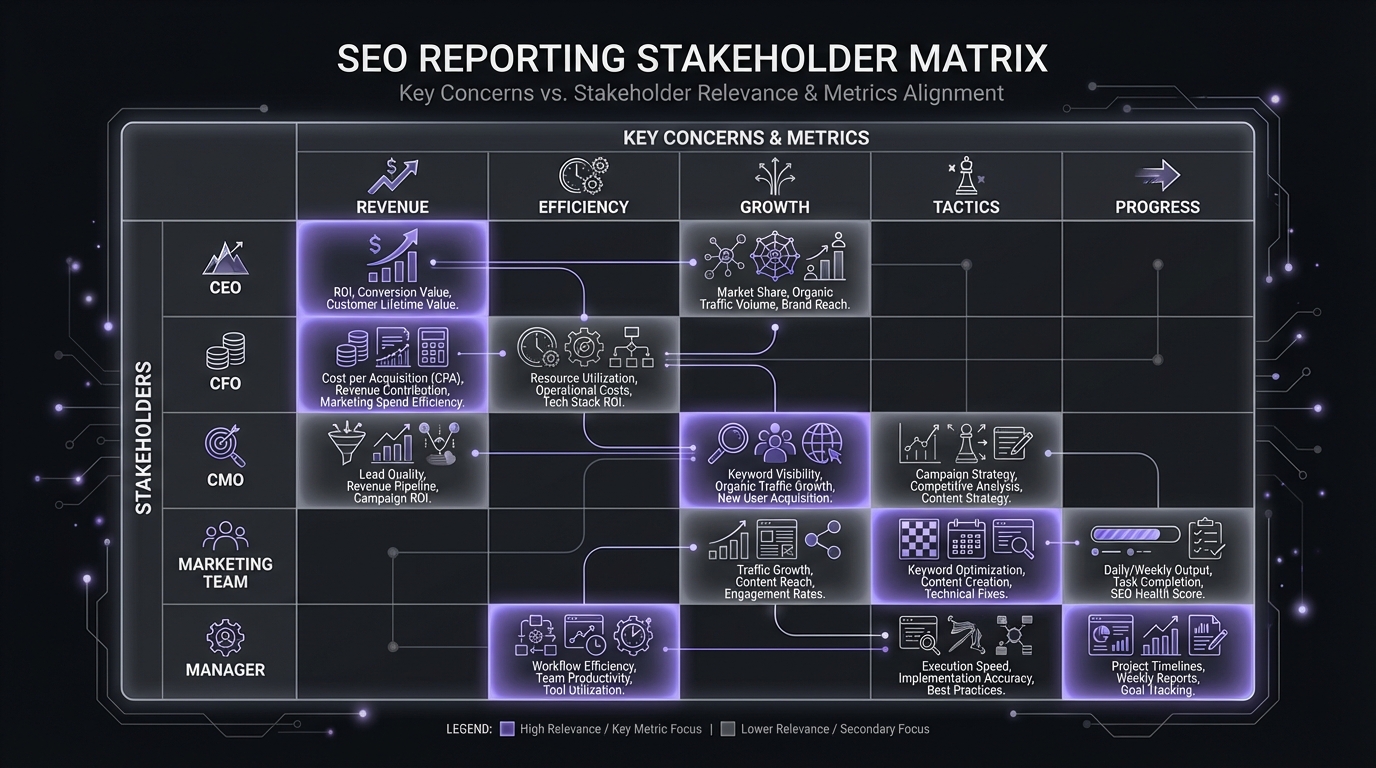
C-Suite Metrics by Role
Different executives care about different metrics based on their responsibilities:
| Role | Primary Metrics | What They're Evaluating |
|---|---|---|
| CEO | ROI, revenue growth, market share | Is SEO driving business growth? |
| CFO | Cost efficiency, ROI vs other channels, budget utilization | Is SEO a good investment? |
| CMO | Conversion rates, acquisition costs, channel comparison | How does SEO fit marketing mix? |
| COO | Operational costs, process efficiency, automation | Is SEO scalable and efficient? |
| CTO | Technical performance, Core Web Vitals, site reliability | Does the site support SEO goals? |
When presenting to mixed leadership, lead with revenue and ROI (universal concerns), then address role-specific metrics in supporting detail.
Executive Reporting (Less Data, More Impact)
C-suite executives—your CEO, CFO, or other senior leadership—operate at the highest strategic level. They're responsible for the entire business, not just marketing or SEO. Their time is extremely limited, and they're constantly making resource allocation decisions across all departments.
For executives, report quarterly rather than monthly (unless specifically requested otherwise). Quarterly cadence aligns with business planning cycles and filters out month-to-month noise to focus on meaningful trends.
Focus exclusively on business impact and strategic direction. Executives want to know: Is organic search driving revenue? Are we on track for our annual targets? How does SEO's ROI compare to other channels? Should we invest more resources here or reallocate them elsewhere?
Report these metrics:
- Revenue or pipeline from organic traffic (the ultimate outcome)
- Year-over-year growth (long-term trajectory)
- Efficiency metrics (revenue per dollar spent, cost per acquisition vs other channels)
- Goal attainment (percentage toward annual target)
Keep it to one page of visuals plus a one-page narrative. Executives will spend 2-3 minutes reviewing your report. Design for that reality. Lead with the single most important insight, support it with 2-3 data points, and make a clear ask if you need a decision or resources.
Skip the technical details entirely. No mention of crawl errors, indexing issues, or ranking changes unless they directly caused a significant business impact that executives need to know about.
Format: One-page dashboard showing key metrics with month-over-month and year-over-year comparisons, plus a one-page narrative explaining what happened, why it matters, and what's next.
Marketing Team Reporting (Tactical Insights)
Your marketing team colleagues—content creators, paid media specialists, product marketers—need completely different information than executives. They're tactical executors who want to understand how SEO connects to their work and where collaboration opportunities exist.
Report weekly or biweekly, matching their sprint cadences. Marketing teams operate in fast-moving cycles and need timely feedback on their work.
Focus on tactical progress, insights that inform their work, and opportunities for collaboration. Content marketers want to know which topics and formats perform best. Paid media teams want to see which organic keywords have high commercial intent for paid campaigns. Product marketers want to understand customer search behavior.
Report these metrics:
- Traffic by content type, page category, or campaign (shows what's working)
- Top performing content (what to replicate)
- Keyword opportunities (topics to cover, gaps to fill). For guidance on finding these opportunities, see How to Read the GSC Queries Report.
- Search behavior insights (what customers are actually searching for)
- Conversion rates by traffic segment (which organic traffic converts best)
Provide significantly more detail than executive reports. Marketing teams want to learn from your insights and apply them to their own work. Share specific examples, show your methodology, explain your reasoning.
Format: Detailed dashboard showing performance breakdowns, a section highlighting insights relevant to specific team members, and a list of collaboration opportunities or action items.
Manager Reporting (Progress and Blockers)
If you report to a marketing director, VP, or team lead, they need yet another reporting approach. Your manager sits between you and executive leadership. They need enough detail to understand your work and coach you, but also need the high-level view to report upward and allocate resources across their team.
Report weekly, either as a dedicated report or in your regular 1:1 meeting. Managers need frequent visibility into progress, blockers, and resource needs.
Focus on progress toward goals, initiative status, and what you need from them. Be honest about challenges—your manager can't help you overcome obstacles they don't know about.
Report these elements:
- Goal tracking (where you stand against quarterly targets)
- Initiative progress (what you shipped, what's in progress, what's blocked)
- Wins worth sharing upward (successes they can communicate to leadership)
- Blockers and resource needs (where you need their help)
- Asks (decisions you need, resources you're requesting, cross-functional support needed)
This is your most detailed report because your manager needs to understand the "how" behind your results. Share methodology, show your data analysis, explain your strategic thinking.
Format: Status update covering goals, wins, challenges, and asks, supported by relevant GSC data and initiative tracking. Include enough context for them to understand your reasoning and enough detail for them to report confidently upward.
The Essential Metrics to Report
With Google Search Console providing dozens of metrics and endless ways to slice data, choosing what to report can feel overwhelming. The solution is a hierarchy: tier your metrics by importance and report accordingly.
The 4 Metrics That Matter Most
At the top of your reporting hierarchy sit four metrics that you should include in virtually every report to every stakeholder. These are your Tier 1 metrics—the ones that connect most directly to business outcomes.
1. Organic traffic (total clicks from Google Search Console)
This is your primary metric. Not sessions from Google Analytics (which includes other sources like Google Ads), but specifically organic clicks from GSC. This measures how many people found your site through unpaid Google search results.
Report the total for your reporting period, the percentage change from the previous period, and the year-over-year change to account for seasonality. For example: "45,000 clicks this month, up 12% from last month and up 28% year-over-year."
2. Conversions from organic traffic
Traffic alone doesn't drive business results—conversions do. Whether you track leads, signups, purchases, or demo requests, report how many came from organic search.
This requires proper tracking setup in Google Analytics 4 with traffic sources properly attributed. The exact conversion metric depends on your business model, but the principle remains the same: connect organic traffic to business outcomes.
3. Revenue or pipeline from organic
If you can track it, this is your ultimate metric. How much revenue or pipeline did organic search generate? Even rough estimates provide valuable context for stakeholders evaluating channel performance and resource allocation.
For e-commerce, this is direct revenue from organic transactions. For B2B SaaS, this might be pipeline value from organic-sourced leads. For lead generation businesses, this might be lead value based on historical close rates.
4. Goal completion rate
Where do you stand against your quarterly or annual goals? If you set a goal of reaching 60,000 monthly clicks by Q4 and you're currently at 45,000 in Q2, you're at 75% of goal with two quarters remaining—that's strong progress.
This metric provides critical context for all your other numbers. A 12% month-over-month increase sounds good, but is it enough to hit your goals? Goal completion rate answers that question.

Leading Indicators (Predicting Future Performance)
Tier 2 metrics provide context for your Tier 1 results and offer predictive insights about future performance. These are your supporting metrics—include them when explaining changes in your primary metrics or when you want to signal future trends.
Impressions: How often your pages appeared in search results, regardless of whether users clicked. This is a leading indicator of future traffic. Significant impression growth often precedes click growth by several weeks as rankings improve but CTR lags. When impressions grow faster than clicks, it signals opportunity to improve your titles and meta descriptions.
Average CTR: What percentage of impressions converted to clicks. This measures how compelling your search results appear to users. Improving CTR is one of the fastest ways to increase traffic without ranking changes.
CTR Benchmarks by Position:
| Position | Expected CTR |
|---|---|
| 1 | 27-32% |
| 2 | 15-18% |
| 3 | 10-12% |
| 4-5 | 6-8% |
| 6-10 | 2-4% |
| 11+ | <2% |
These benchmarks help contextualize your CTR performance. If you're ranking position 3 with 15% CTR, you're outperforming typical results for that position.
Average position: Your overall average ranking position across all queries. Use this cautiously—average position can be misleading because it treats all queries equally regardless of search volume. Still, directional changes (improving from 18 to 15 over several months) indicate broad ranking improvements.
New vs returning organic traffic: Are you attracting new visitors or seeing increased engagement from existing ones? Growing new organic traffic indicates improving discovery and awareness. This requires Google Analytics 4 integration, but the insight is valuable for understanding growth composition.
When to Include Technical Metrics
Tier 3 metrics are diagnostic—include them only when explaining specific changes or addressing concerns. These are technical details that matter for execution but rarely belong in stakeholder reports unless they directly caused significant business impact.
Top gaining and losing pages: When explaining traffic changes, showing which specific pages drove growth or decline adds valuable context. "Traffic grew 12% because our three product comparison pages gained 3,500 combined clicks after we refreshed them with 2024 data" is much more actionable than just reporting the 12% growth. Learn how to analyze your top pages effectively to identify the biggest movers.
Index coverage and crawl stats: Only report these when they explain performance issues. If traffic dropped because a technical issue caused deindexing of important pages, that's worth reporting. Otherwise, these are execution details you handle without stakeholder involvement.
Core Web Vitals: Report when they explain user experience issues or when you've made significant improvements that impact business metrics. "We improved our Largest Contentful Paint from 4.2s to 2.1s, which correlated with a 15% increase in organic conversion rate" connects technical metric to business outcome.
Individual keyword rankings: Avoid reporting these except for a small set of strategic keywords that executives specifically care about. Rankings fluctuate daily, and reporting every ranking change trains stakeholders to focus on the wrong metrics. Focus on aggregate traffic and conversions instead.
What NOT to Report
Some metrics popular in SEO circles should almost never appear in stakeholder reports:
- Domain Authority / Domain Rating: Not Google metrics. Proprietary scores from third-party tools that don't directly correlate with rankings or traffic.
- Total backlinks: Quantity doesn't equal quality. 1,000 spam links matter less than 10 relevant, authoritative links.
- Social shares: Not an SEO metric and not a ranking factor. Social media success is worth reporting separately, but it doesn't belong in SEO performance reports.
- "SEO Score" from auditing tools: These arbitrary scores from various tools aren't standardized or meaningful to stakeholders. Focus on actual performance metrics.
Data Storytelling: Creating a Narrative
Numbers alone don't persuade or inform. Stakeholders need narrative—a story that explains what happened, why it matters, and what comes next. The difference between a forgettable report and one that drives action is storytelling.
Every report should follow a clear narrative structure that guides readers through your data to your insights.
The Narrative Structure for Reports
Effective data narratives follow a simple framework: Situation, Action, Result, Analysis, Implication. This structure takes stakeholders on a logical journey from context to insight to next steps.
Situation: Establish the baseline. Where were you at the start of this reporting period? What were you trying to accomplish? What was the starting point against which progress should be measured?
Example: "At the start of Q2, organic traffic was 38,000 clicks per month. Our quarterly goal was to reach 48,000 clicks by end of Q2, requiring 26% growth over three months."
Action: Describe what you did during the period. What initiatives did you execute? What changes did you make? What strategy did you follow?
Example: "In April and May, we implemented our content refresh initiative, updating 35 high-performing but outdated pages with current data, improved formatting, and expanded coverage. We prioritized pages ranking positions 5-15 with high impression volume."
Result: Present the data. What actually happened? Show the numbers without interpretation yet.
Example: "By end of Q2, organic traffic reached 51,000 clicks per month—up 34% from the Q2 start and 6% above our goal. The 35 refreshed pages contributed 8,500 of those clicks, a 78% increase for that page segment."
Analysis: Explain why the results occurred. Connect actions to outcomes. This is where your expertise adds value.
Example: "The content refresh strategy worked because we focused on pages with existing traffic and ranking positions close to page one. These pages already had authority and relevance—they just needed updated information to serve user intent better. Average position improved from 8.2 to 4.3 for refreshed pages, driving the click increase."
Implication: Translate results to business impact and signal what's next. Why should stakeholders care about these results? What do they mean for business goals? What will you do next?
Example: "This 13,000 click increase translates to approximately $65K in additional monthly revenue based on our organic conversion rate and average order value. We'll scale this approach to 75 more pages in Q3, prioritizing the next highest-opportunity segment. At similar lift rates, we're projecting to exceed our annual traffic goal by 15%."
Connecting Data to Business Outcomes
The most critical skill in stakeholder reporting is connecting SEO metrics to business outcomes. This requires understanding your business model and having tracking in place to measure the customer journey.
For each major metric change, ask yourself: "What does this mean for revenue, leads, or other business goals?" If you can't answer that question, either improve your tracking or don't include the metric.
Here's the translation framework:
Clicks → Traffic → Engagement: More people finding and visiting your site increases brand awareness and top-of-funnel activity.
Traffic → Conversions → Leads/Sales: Site traffic converts at your conversion rate to generate business outcomes. A 5,000 click increase at a 3% conversion rate yields 150 more conversions.
Conversions → Revenue/Pipeline: Those conversions have business value. In e-commerce, that's direct revenue. In B2B, that's pipeline value based on average deal size and close rate.
Efficiency → Cost Comparison: Organic traffic has acquisition cost (your time and resources). Compare your cost per organic acquisition to paid channels to demonstrate ROI.
Make these connections explicit in your reporting. Don't assume stakeholders will do the math themselves—show your work.
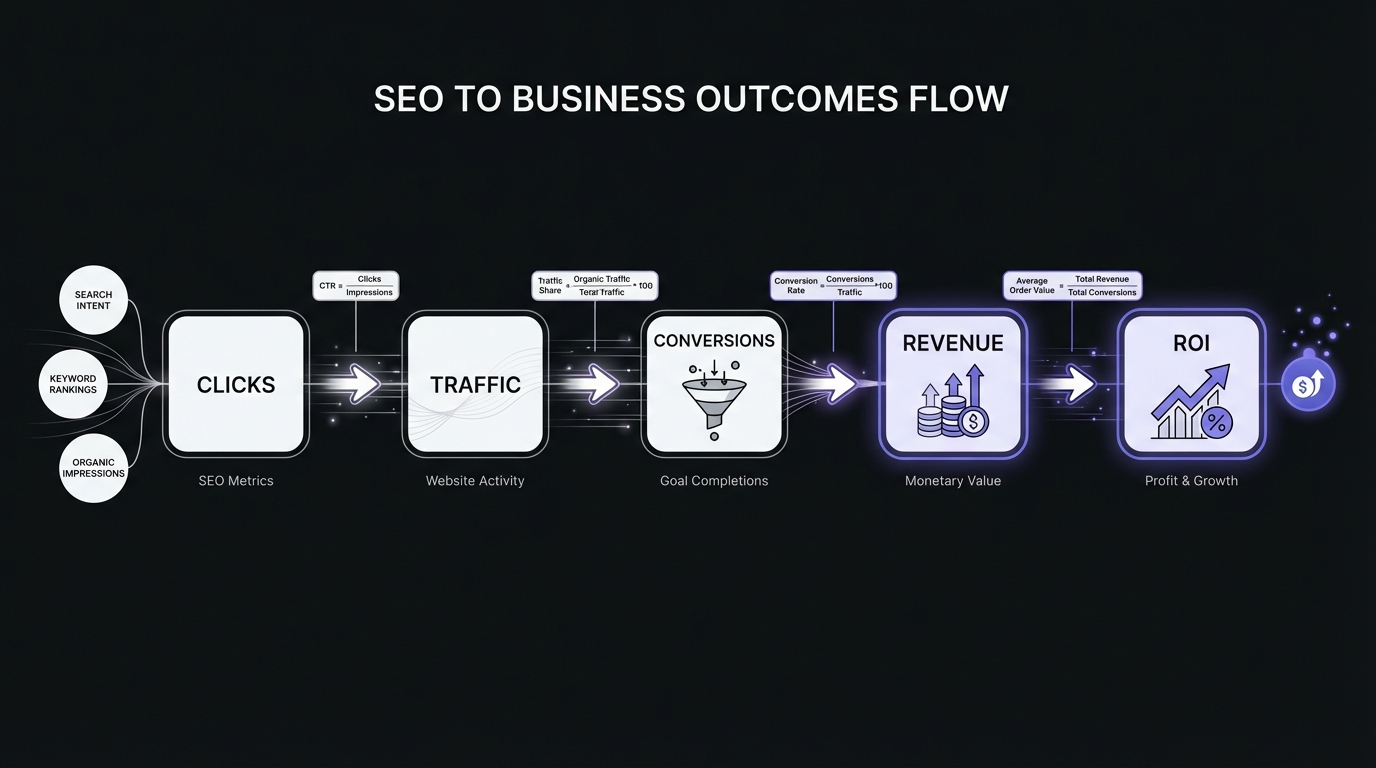
Key Formulas for Business Translation
When connecting SEO metrics to business outcomes, use these standard formulas:
Click-Through Rate (CTR):
CTR = (Clicks ÷ Impressions) × 100
Example: 4,500 clicks ÷ 150,000 impressions = 3.0% CTR
Cost Per Acquisition (CPA):
CPA = Total SEO Investment ÷ Total Conversions
Example: $8,000 monthly SEO spend ÷ 200 conversions = $40 CPA
SEO ROI:
ROI = ((Revenue from Organic − SEO Cost) ÷ SEO Cost) × 100
Example: (($50,000 revenue − $8,000 cost) ÷ $8,000) × 100 = 525% ROI
Customer Lifetime Value from Organic:
CLV = Average Order Value × Purchase Frequency × Customer Lifespan
Example: $150 AOV × 4 purchases/year × 3 years = $1,800 CLV
Include these calculations in your reports to demonstrate exactly how SEO metrics translate to business value. Executives appreciate seeing the math, not just the conclusions.
Visual Storytelling (Charts That Tell Stories)
Charts and visualizations should enhance your narrative, not replace it. Every chart in your report should have a clear purpose and tell part of your story.
Line charts show trends over time. Perfect for demonstrating traffic growth, seasonal patterns, or goal progress. Add annotations to mark important events: "Content refresh launched," "Algorithm update," "New campaign started." These annotations connect chart changes to real-world actions.
Bar charts compare categories or time periods. Use them to show top performing pages, traffic by category, or month-over-month comparisons. Keep categories to 5-10 maximum—too many bars become hard to scan.
Tables present precise numbers when exact values matter. Use them for top/bottom performers when you want stakeholders to see specific pages or keywords. Always sort meaningfully (by impact, not alphabetically) and highlight the most important rows.
Avoid pie charts for anything with more than 3-4 slices. They're hard to read accurately, and humans struggle to compare angular proportions. Bar charts communicate the same information more clearly.
The most important visual guideline: every chart needs a clear title that states its point. Not "Organic Traffic Over Time" but "Organic Traffic Grew 28% YoY, Exceeding Goal by 6%." Your chart title should communicate the insight, not just describe the data.
Dashboard Design: What to Include
A well-designed dashboard answers the most important questions at a glance. Think of it as the executive summary of your data—the view that busy stakeholders can scan in 30 seconds to understand the current state and any significant changes.
The 5-7 metric rule: Research shows that dashboards with more than 7 key metrics become overwhelming, while fewer than 5 may seem incomplete. Aim for 5-7 primary metrics prominently displayed, with supporting details available but not competing for attention. Studies indicate only 28% of stakeholders actively use dashboards after initial implementation—keeping yours focused increases the odds of sustained engagement.
The One-Page Dashboard Formula
The goal of a one-page dashboard is clarity and hierarchy. Lead with what matters most and provide progressive detail as the reader moves down the page.
Header section (top): Show the date range and your single most important metric prominently. This should be your current month's organic clicks, shown as a large number with clear month-over-month and year-over-year comparisons.
Example layout:
May 2026 Organic Performance

45,234 clicks
+12% vs last month | +28% vs last year | 75% of annual goal
Primary metrics (large, clear numbers): Below the header, display your four core Tier 1 metrics in a row or 2x2 grid:
- Total clicks: 45,234
- Total impressions: 2.1M
- Average CTR: 4.1%
- Average position: 15.3
Use visual indicators (green up arrows, red down arrows) to show directional changes, but always include the actual percentage change. Colors help with scanning, but numbers provide precision.
Trend visualization (middle): Include a line chart showing the last 12-16 months of traffic. This provides context for whether current performance is part of a broader trend or a significant change. Overlay your goal trajectory if you have quarterly targets.
Performance breakdown (lower middle): Show what's driving your results:
- Top 5 gaining pages (table: URL, clicks, change %)
- Top 5 losing pages (table: URL, clicks, change %)
- Traffic by device (mobile vs desktop bar chart)
- Traffic by page category (if you have clear segments)
Initiative tracking (lower): Brief status of current strategic initiatives:
- Q2 Goal: 48K clicks → Current: 51K (Complete ✓)
- Content refresh initiative: 35/40 pages complete
- Technical site speed improvements: In progress
Health indicators (bottom): One-line status checks on technical health:
- Index coverage: 4,523 pages indexed, 12 pages with issues
- Core Web Vitals: 89% of pages passing
Color Coding and Visual Hierarchy
Use color purposefully to draw attention and communicate meaning quickly:
Green indicates positive performance, metrics above target, or successful completion. Use it for metrics that improved or goals achieved.
Red indicates problems, metrics below target, or declining performance. Use it sparingly—reserve red for issues that actually need attention, not every small decline.
Yellow/orange indicates caution, metrics at risk, or slight underperformance. Use it for trends that aren't critical yet but warrant monitoring.
Gray for neutral information or secondary data that provides context but doesn't require action.
The danger is overusing red and yellow, which creates alarm fatigue. Not every metric below target is a crisis. Save red for actual problems that need stakeholder attention.
Visual hierarchy matters as much as color. The most important information should be:
- Larger (bigger font, bigger numbers)
- Higher on the page (people scan top to bottom)
- More visually distinct (bold, color, boxes)
Your header metric should be the largest element. Secondary metrics should be smaller but still prominent. Tertiary details should be noticeably smaller. This visual hierarchy guides attention to what matters most.
Tools for Dashboard Creation
You don't need expensive tools to create effective dashboards. The best tool is the one you'll actually use consistently.
Google Sheets (Free): Surprisingly powerful for dashboard creation. Pull data from GSC manually or via the Google Sheets add-on, create charts, and format for clarity. Advantage: Universal access, no additional tools to learn. Disadvantage: Manual updates, limited interactivity.
Google Looker Studio (formerly Data Studio) (Free): Connects directly to Google Search Console and Analytics, automatically refreshes data, and provides drag-and-drop dashboard creation. This is the best free option for most SEO reporting. Advantage: Automated data refresh, professional appearance, easy sharing. Disadvantage: Learning curve for setup, can be slow with large datasets.
Tableau or Power BI (Paid, enterprise): Powerful business intelligence platforms with advanced visualization capabilities. Worth it for large organizations with complex reporting needs across departments. Advantage: Extremely flexible, beautiful visualizations, advanced features. Disadvantage: Expensive, steep learning curve, overkill for most SEO reporting.
Agency reporting tools like AgencyAnalytics or Whatagraph (Paid): Designed specifically for marketing reporting, these offer white-labeled reports and client dashboards. Good for agencies managing multiple clients. Advantage: Templates and automation, client-friendly. Disadvantage: Monthly cost, sometimes limited customization.
For most situations, start with Google Looker Studio. It's free, integrates directly with GSC, and provides professional-looking dashboards that automatically update. You can always graduate to more sophisticated tools if your needs outgrow it.
Monthly Report Template
While dashboards provide at-a-glance metrics, monthly written reports add the narrative layer that turns data into insights. Here's a proven structure for monthly reports to marketing leadership.
The Five-Section Monthly Report
Your monthly report should be 3-4 pages maximum: one page dashboard plus 2-3 pages of narrative. Remember that stakeholders will spend 5-10 minutes with your report—design for that reality.
Page 1: Executive Summary Dashboard
Lead with your one-page dashboard (described in the previous section). This gives scanners the key information immediately and serves as a visual reference for readers as they move through your narrative.
Pages 2-3: Narrative Report
Section 1: This Month's Highlights (150 words)
Start with your three biggest wins or most significant developments. Lead with business impact, not activities.
Example:
- Exceeded Q2 goal by 6%: Reached 51,000 clicks vs 48,000 goal, driven by content refresh initiative
- Product page traffic up 34%: Comparison pages gaining traction after optimization, contributing $45K incremental revenue
- New high-value keyword rankings: Achieved first-page positions for three commercial-intent keywords with $120K annual traffic potential
Notice these highlights connect to business outcomes (revenue, goals achieved, future opportunity) rather than activities (published X posts, built Y links).
Section 2: Performance Analysis (300 words)
Dive deeper into what changed and why. Use your Situation-Action-Result-Analysis-Implication framework here.
Explain traffic changes with specificity. Not just "traffic increased 12%" but "traffic increased 12% (5,200 clicks), primarily driven by our 35 refreshed product comparison pages which contributed 3,500 of those clicks. The remaining 1,700 click increase came from continued gains in our Q1 blog content, which is still building authority."
Highlight top performing content or pages. "Our 'Best CRM Software for Small Business' comparison page became our #2 traffic generator at 2,800 clicks this month, up from position #8 last month. This page ranks #2 for its primary keyword and #1 for three related long-tail queries."
Address any losses proactively. "Our resource center traffic declined 8% (600 clicks) as Q1 seasonal interest in end-of-year topics waned. This decline was expected based on historical patterns and doesn't signal a problem."
Always compare to goals. "At 51,000 clicks, we're 106% of our Q2 goal and 75% of our annual goal with two quarters remaining, putting us on track to exceed our year-end target by approximately 12%."
Section 3: Insights & Learnings (200 words)
Share what you learned that informs future strategy. This section adds value beyond just reporting what happened—it demonstrates strategic thinking.
Example insights:
- "Product comparison content continues to outperform feature descriptions, generating 3X more traffic and 40% higher conversion rates. We should shift more content resources to comparisons vs single-product pages."
- "Pages ranking positions 5-10 showed 65% CTR improvement after title optimization. This quick-win tactic should be systematized for all high-impression position 5-15 pages."
- "Mobile traffic grew 22% while desktop grew only 4%, suggesting mobile experience should be the primary design consideration for new content."
These insights help stakeholders understand not just what you did, but what you're learning about your audience and what works in your market.
Section 4: Initiative Progress (150 words)
Update on planned initiatives and projects. What shipped, what's in progress, what's blocked?
Example:
- Content refresh program: Completed 35/40 Q2 pages (87%). Final 5 pages scheduled for completion next week. Results exceeded projections with 78% average traffic lift.
- Technical site speed improvements: In progress. Dev team implementing image optimization. Expected completion mid-June. Projected impact: 10-15% improvement in Core Web Vitals.
- New product category content: On hold. Waiting for product team to finalize Q3 launch details before creating content. No impact on Q2 goals.
Be honest about blockers and delays. Your stakeholders can't help resolve issues they don't know about.
Section 5: Next Month's Plan (150 words)
What you'll focus on next month and what you expect to achieve. Set expectations and flag any decisions or resources you need.
Example: "In June, we'll focus on scaling our content refresh approach to 50 additional pages in the resource center. Based on Q2 results, we're projecting a 60-70% traffic lift for these pages, contributing approximately 4,000 additional clicks. We'll also begin the technical site speed initiative, which should complete mid-month.
We're on track to meet Q2 goals and are raising our Q3 target from 54,000 to 57,000 clicks based on performance exceeding projections.
Decision needed: To scale content refreshes from 50 to 100 pages in Q3, we need one additional contractor for content updates (estimated $4,000/month, ROI 8X based on Q2 performance)."
Writing for Scanability
Most stakeholders will scan your report before reading it in depth (if they read in depth at all). Design for scanability:
-
Use headers and subheaders liberally: Break up text blocks with descriptive headers that communicate key points even if the reader never reads the body text.
-
Bold key numbers and insights: Make the most important data points stand out visually so scanners can spot them.
-
Bullet points over paragraphs: Lists are easier to scan than dense paragraphs. Use bullets whenever you're presenting multiple related points.
-
One key insight per paragraph: Start each paragraph with your point, then support it. Don't bury insights mid-paragraph where scanners will miss them.
-
Ample white space: Don't pack text edge to edge. White space improves readability and reduces cognitive load.
How Long Should Reports Be?
Monthly reports should be 3-4 pages total: one page dashboard plus 2-3 pages of narrative. Going beyond 5 pages significantly reduces readership.
Quarterly business reviews (covered next) can be longer at 8-10 slides, but only because they're presented rather than read independently.
When in doubt, shorter is better. Every additional page reduces the likelihood stakeholders will read the whole report. Ruthlessly edit to keep only essential information.
Quarterly Business Review (QBR) Template
Quarterly reviews differ fundamentally from monthly reports. While monthly reports are written documents stakeholders read independently, QBRs are typically presentations—you're in the room (or on the Zoom) walking stakeholders through your content and answering questions.
This format change affects both content and structure.
The Eight-Slide QBR Structure
Slide 1: Quarter Recap
One slide that sets context. Show your quarterly goal vs actual result, overall performance trend, and 2-3 headline wins or challenges.
Use a large number to show goal attainment: "Q2 Goal: 106%" or "51K clicks vs 48K goal."
Keep this high level—you'll go deeper on subsequent slides. The purpose is orientation: where did we aim, where did we land, and how should stakeholders feel about the quarter overall?
Slide 2-3: Performance Deep Dive
Two slides examining the numbers behind your quarter recap.
Slide 2: Traffic trends. Show the three-month progression, compare to previous quarter and previous year. Break down by major traffic segments if relevant (blog vs product pages, category performance, device split).
Slide 3: Conversion and revenue trends. How did organic traffic convert? What revenue or pipeline did organic generate? How do these metrics compare to previous periods and other channels?
This is where you connect SEO metrics to business outcomes. Executives care less about the traffic growth and more about whether that growth translated to business results.
Slide 4: What Worked / What Didn't
One of the most valuable slides for strategic planning. Divide the slide into two columns:
What Worked (Double Down):
- Content refresh initiative: 78% avg traffic lift, 8X ROI
- Position 5-15 optimization: Quick wins with 45-day payback
- Product comparison content: 3X traffic vs feature content
What Didn't Work (Pivot or Stop):
- New blog category: Low traffic, low conversion, high effort
- Link building outreach: 5% response rate, minimal impact
- Social promotion: No measurable organic traffic impact
Be honest about failures. Stakeholders appreciate leaders who learn from mistakes and adapt strategy. This section demonstrates you're data-driven and strategic, not just executing a fixed plan regardless of results.
Slide 5: Competitive Landscape
Briefly address competitive positioning. You don't need extensive competitive analysis every quarter, but stakeholders want assurance you're aware of the market.
Show:
- Market share trends (if you have data)
- Notable competitor movements (new content strategies, big ranking changes)
- Your positioning (areas where you're winning, areas where you're behind)
Keep this fact-based and avoid making it an excuse slide. If competitors are ahead, acknowledge it and explain your strategy to close the gap.
Slide 6-7: Next Quarter Strategy
Two slides outlining Q3 (or whatever next quarter) plans.
Slide 6: Goals and strategic focus. What are you trying to achieve? What will you focus on? Why these priorities?
Slide 7: Major initiatives. Describe your 3-5 key initiatives, expected outcomes, timelines, and resource requirements.
Be specific about expected outcomes: "Scale content refresh to 100 pages. Expected impact: 8,000 additional monthly clicks by end of Q3, contributing $40K incremental monthly revenue."
This section is future-focused and strategic. You're demonstrating you have a plan, know how to measure success, and understand what you need to execute.
Slide 8: Asks / Decisions Needed
End with a clear call to action. What do you need from stakeholders?
This might include:
- Budget requests (tools, contractors, content production)
- Headcount needs (if you need additional team members)
- Strategic decisions (should we pursue X market segment? Should we deprioritize Y content type?)
- Cross-functional collaboration (need dedicated dev time for technical improvements, need product team input on content roadmap)
Be specific about what you're asking for, why you need it, and what impact it will enable. Make it easy for stakeholders to say yes by demonstrating ROI.
Presenting QBRs (Delivery Tips)
Quarterly business reviews are performances, not just information delivery. Your presentation matters as much as your content.
Start with the headline: Lead with your biggest insight or most important point. "We exceeded our Q2 goal by 6% and are on track to beat our annual target by 12%." Hook their attention immediately.
Tell the story, don't read slides: Your slides should be visual with minimal text. You provide the narration. If stakeholders can read everything on your slides, they'll read ahead instead of listening to you.
Prepare for questions: Anticipate what stakeholders will ask and have backup slides or data ready. Common questions include competitive benchmarks, why certain initiatives didn't work, and ROI calculations.
Time management: Practice timing your presentation. If you have 30 minutes scheduled, plan for 15-20 minutes of presentation to leave time for questions and discussion. Running over time frustrates busy executives.
End with your ask: Don't let the meeting end without addressing your needs. If you need a decision or resources, make that clear before stakeholders leave the room.
Handling Tough Questions
You will face challenging questions in QBRs. Prepare for them.
"Why aren't we ranking #1 for [competitive keyword]?"
Explain difficulty level, timeline, and resources required. Show what you ARE ranking for and its business value. Reframe from "we're not #1" to "here's our strategy to improve position and capture more of this opportunity."
"Our competitor is ranking above us. What are you doing about it?"
Show your competitive analysis and your strategic plan to close the gap. Highlight areas where you're winning. Be honest about where competitors are stronger and how long it will take to catch up.
"Why did traffic drop this month?"
Come prepared with diagnosis (algorithm update, technical issue, seasonality). Show your recovery plan and timeline. Having analyzed this before the meeting demonstrates you're on top of issues.
"What's our ROI on SEO?"
Have this calculation ready: organic acquisition cost (your salary/contractor costs, tools, content production) divided by organic revenue or leads generated. Compare to other channels (paid search, paid social) to contextualize.
The key to handling tough questions is preparation. Don't wing it—anticipate objections and have data-backed responses ready.
Handling Common Stakeholder Questions
Beyond formal reports, you'll field ad-hoc questions from stakeholders. Having prepared responses demonstrates expertise and prevents you from being caught off-guard.
The Question Behind the Question
Often, stakeholder questions have subtext. Learn to hear what they're really asking.
When they ask: "Why aren't we ranking #1 for [keyword]?"
They're really asking: "Are you competent? Is SEO working? Should we invest more or less here?"
Your answer should address both the surface question and the underlying concern. Explain the keyword's difficulty and timeline, but also reassure them about overall strategy and progress toward business goals.
When they ask: "Our competitor is ranking above us. What are you doing about it?"
They're really asking: "Are we falling behind? Are you aware of competitive threats? Do you have a plan?"
Your answer should show competitive awareness, strategic thinking, and confidence. Even if you're behind in some areas, demonstrate you know why, have a plan, and are making progress in areas that matter most for business outcomes.
When they ask: "Can't you just optimize the website better?"
They're really asking: "Why is this taking so long? Is SEO harder than I think, or are you not working hard enough?"
Your answer should educate them about SEO reality (it's ongoing, not one-time), show the work you're doing, and manage expectations with realistic timelines. Share competitive benchmarks to contextualize the challenge.
Preparing Your FAQ Document
Create a document answering the most common stakeholder questions you receive. Share it proactively (perhaps as an appendix to your quarterly review) and reference it when questions arise.
Include:
SEO Timeline Questions:
- How long until we see results from [initiative]?
- When will we reach our goal?
- Why does SEO take so long?
Competitive Questions:
- Why is [competitor] ranking above us?
- How do we compare to industry leaders?
- What's their secret we're missing?
Strategy Questions:
- Why are you focusing on [initiative] vs [alternative]?
- Should we be doing [tactic I heard about]?
- How do you decide what to work on?
ROI Questions:
- What's our return on SEO investment?
- How does organic compare to paid channels?
- Is SEO worth the investment?
For each question, provide a clear, concise answer with supporting data. This document saves you time answering the same questions repeatedly and helps stakeholders self-serve answers to common concerns.
Tools for SEO Reporting
You don't need expensive tools to create effective reports, but the right tools can save significant time and enable automated reporting that stays current without manual effort.
Free Tools That Work Well
Google Search Console is your primary data source. Everything in this guide starts with GSC data because it's the most accurate representation of your organic search performance. It's free, provided by Google, and should be the foundation of all SEO reporting.
Google Analytics 4 provides conversion tracking and revenue attribution. GSC tells you about search visibility and clicks, but GA4 tells you what happens after users land on your site. The two tools together provide complete funnel visibility.
Google Sheets enables manual dashboard creation with full control over layout and formatting. Pull data from GSC using the Search Console add-on, create calculated fields, build charts, and format for clarity. For small-scale reporting or one-off analysis, Sheets is often sufficient and requires no learning curve.
Google Looker Studio (formerly Data Studio) is the best free tool for automated dashboards. Connect directly to GSC and GA4, build dashboards with drag-and-drop interface, and share with stakeholders. Data refreshes automatically, so your dashboard stays current without manual updates. The only cost is time to build initial templates.
When to Invest in Paid Reporting Tools
Paid tools make sense when:
You're reporting to multiple stakeholders with different needs: Agency reporting tools like AgencyAnalytics or Whatagraph enable multiple white-labeled dashboards and automated report delivery. If you're managing 5+ clients or business units, automation saves significant time.
You need advanced visualizations: Business intelligence platforms like Tableau or Power BI offer visualization capabilities beyond what Looker Studio provides. If you're in a data-driven organization that values sophisticated analysis, these tools justify their cost.
You're combining data from many sources: If your reports pull from GSC, GA4, paid search platforms, social media tools, and internal databases, enterprise tools handle data integration more smoothly than manual consolidation in Sheets.
Your organization already licenses these tools: If your company has Tableau, Power BI, or other BI platforms, leverage them for SEO reporting to maintain consistency with other department reports.
For most small to mid-size businesses and in-house SEO teams, free tools provide everything needed. Start with Google Looker Studio and only upgrade to paid tools when you've clearly outgrown free options.
Common Reporting Mistakes
Even with templates and frameworks, certain mistakes persist. Avoid these pitfalls to keep your reporting effective.
1. Reporting on rankings instead of traffic
Rankings fluctuate daily based on personalization, location, and other factors. A site can rank #3 one day and #6 the next without any real change in performance. Rankings also don't account for search volume—ranking #1 for a keyword with 10 monthly searches is meaningless.
Focus on traffic (clicks) instead. Traffic is what actually drives business outcomes, and it's a more stable, meaningful metric than individual rankings.
2. No year-over-year comparison
Month-over-month comparisons show whether you're moving in the right direction, but they miss seasonal patterns. Traffic might be down 10% month-over-month simply because you're entering a seasonally slower period.
Always include year-over-year comparisons to account for seasonality. "Traffic is down 8% vs last month but up 25% vs this month last year" tells a completely different story than "traffic is down 8%."
3. Cherry-picking wins while hiding losses
Only highlighting successes while ignoring declines or failures damages credibility. Stakeholders aren't naive—they know not everything works. When you only report wins, they question what you're not telling them.
Be honest about what's not working. Explain what you've learned and how you're adapting. This builds trust and positions you as a strategic thinker who learns and adjusts, not someone who hides problems.
4. No forward-looking section
Reports that only look backward miss an opportunity to shape future strategy and resource allocation. Stakeholders want to know what's next and whether you need anything from them.
Every report should include a "next steps" or "next month's plan" section. This positions you as proactive and strategic, not just a reporter of historical data.
5. Too much data, not enough insight
Fifty charts showing every possible metric breakdown creates cognitive overload. Stakeholders can't extract meaning from data dumps—they need you to provide interpretation and insight.
For every metric you include, ask: "What's the insight here? What should stakeholders understand or do based on this?" If you can't answer, remove the metric.
6. No business context
Technical metrics without business translation leave stakeholders wondering "so what?" You understand what a 5-point position improvement means, but executives don't.
Always connect SEO metrics to business outcomes: traffic to leads, leads to revenue, efficiency to cost savings. Make it explicit—don't assume stakeholders will make the connections themselves.
7. Burying the lede
Starting with background and methodology before revealing results loses your audience. Busy stakeholders may never make it to page 3 where you finally share that traffic grew 35%.
Lead with your most important point. Put the headline upfront: "Organic traffic grew 35% and exceeded our quarterly goal by $50K." Then provide supporting details for readers who want them.
Conclusion: From Data to Impact
The difference between ignored SEO reports and ones that drive decisions and investment comes down to translation. Your job isn't just to track metrics—it's to translate those metrics into business language stakeholders understand and care about.
Remember these key principles:
Know your audience: Executives need different reports than marketing teams. Tailor metrics, detail level, and frequency to each stakeholder type. One report doesn't fit all.
Focus on business outcomes: Traffic and rankings are means to an end. The end is revenue, conversions, and business growth. Connect every metric to these outcomes.
Tell a story: Data without narrative is just numbers. Use the Situation-Action-Result-Analysis-Implication framework to transform data into insights.
Keep it concise: Respect stakeholder time. Monthly reports should be 3-5 pages. QBRs should be 8-10 slides. If you can't communicate value in that space, more pages won't help.
Always include next steps: Looking forward is as important as looking back. Show stakeholders you have a plan and know what you need to execute it.
Prepare for questions: Anticipate objections and tough questions. Have data-backed responses ready so you're confident and credible in the moment.
Effective stakeholder reporting does more than inform—it builds confidence in your work, secures resources and buy-in for your initiatives, and positions SEO as a strategic growth driver rather than a technical cost center.
Next Steps
Ready to improve your SEO reporting? Here's how to start:
This week:
- Identify your stakeholder types and their specific reporting needs
- Determine appropriate cadence for each audience (weekly, monthly, quarterly)
- Set up basic tracking for conversions and revenue from organic traffic
This month:
- Download the monthly report template and customize for your business
- Create your first one-page dashboard in Google Looker Studio
- Document your most common stakeholder questions and prepare responses
This quarter:
- Establish regular reporting cadence with each stakeholder group
- Prepare and deliver your first quarterly business review presentation
- Gather feedback on what's working and adjust format as needed
The investment you make in improving your reporting will pay dividends in stakeholder confidence, resource allocation, and your ability to secure buy-in for strategic initiatives.
Want stakeholder-ready SEO reports without the manual work? [Product Name] automatically generates business-focused SEO reports from your Google Search Console data, with narrative insights, revenue attribution, and beautiful visualizations that stakeholders actually understand. Start your free trial
Related Resources
- Setting Realistic SEO Goals Based on Your Current Performance - Learn to set achievable goals that make reporting meaningful
- Building an SEO Roadmap from Performance Data - Connect reporting to strategic planning
- Setting Up Your SEO Baseline - Establish metrics to report against
- Google Search Console Mastery - Deep dive into your primary data source
- Performance Analysis Framework - Analyze the metrics you're reporting
Published: [Date] Author: [Name] Category: Actionable SEO Strategies Tags: SEO reporting, stakeholder communication, SEO dashboard, executive reporting, SEO metrics, business outcomes, data storytelling
Downloadable Templates: