Track AI Overview Visibility in GSC
Step-by-step guide to measuring AI Overview visibility using Google Search Console. Track AI search impact and monitor citation rates.

How to Track AI Overview Visibility Using GSC
Introduction
Google Search Console doesn't directly show AI Overview visibility—yet. But with smart filtering and analysis, you can track your AI search performance.
As Google's AI Overviews continue to reshape the search landscape, understanding their impact on your traffic has become critical. The challenge? Google Search Console doesn't (yet) provide separate reporting for AI Overview impressions, citations, or click-through rates. You're left looking at aggregate metrics that blend traditional organic results with AI-powered search experiences.
The good news: with the right methodology, you can use GSC's existing data to track your AI Overview exposure, monitor citation frequency, and measure the effectiveness of your optimization efforts.
What this guide covers:
- A practical GSC-based methodology for tracking AI Overview visibility
- Step-by-step instructions for identifying AI-affected queries
- CTR analysis techniques to measure AI impact
- Creating a free tracking dashboard using Google Sheets
- Third-party tools and when they're worth the investment
What you'll be able to do after reading this:
- Establish a baseline for your AI Overview exposure
- Track changes in AI visibility over time
- Identify which content is most/least affected by AI Overviews
- Measure the impact of your optimization efforts
- Make data-driven decisions about content strategy
Prerequisites: Access to Google Search Console with at least 3 months of historical data.
Let's dive into the measurement challenge and build a practical tracking system you can implement today.
The Measurement Challenge
What Google Currently Tracks
Google Search Console provides comprehensive data about your organic search performance—impressions, clicks, average position, and click-through rate. However, when it comes to AI Overviews, GSC currently treats them as part of the aggregate organic search experience.
Here's what GSC does track:
- Traditional organic impressions (queries where your site appeared in results)
- Clicks from all organic sources (including potential AI Overview citations)
- Average position for traditional blue link results
- Device, country, and query-level performance metrics
What's missing:
- No separate impression type for "AI Overview shown"
- No indication whether you were cited as a source in an AI Overview
- No differentiation in CTR between traditional results and AI Overview-influenced results
- No direct measurement of AI Overview visibility trends
Why Google hasn't separated this data: The official line is that AI Overviews are an evolving part of the search experience, not a separate search feature like Featured Snippets or Knowledge Panels. Google's Search Liaison has hinted that dedicated reporting may come in the future, but there's no confirmed timeline.
How prevalent are AI Overviews? The scope of the problem is significant and growing:
- AI Overviews appear in 15-25% of queries according to Semrush research
- Some studies report AI Overviews in up to 47% of Google search results
- US desktop searches showing AI Overviews grew from 6.49% in January to 13.14% in March 2025
- On mobile, AI Overviews can occupy nearly half the screen, pushing organic results far below the fold
What We Need to Know
To effectively optimize for AI Overviews and understand their impact, we need answers to five key questions:
- Which of our queries trigger AI Overviews? Understanding your exposure level helps prioritize optimization efforts.
- Are we cited as sources in AI Overviews? Being cited indicates authority and can drive brand awareness even if CTR is reduced.
- How does AI Overview presence affect our CTR? Quantifying the traffic impact guides strategic decisions.
- Is our AI Overview visibility increasing or decreasing? Trend analysis shows whether optimization efforts are working.
- Which content types are most/least affected? Content strategy decisions depend on understanding what's vulnerable vs. protected.
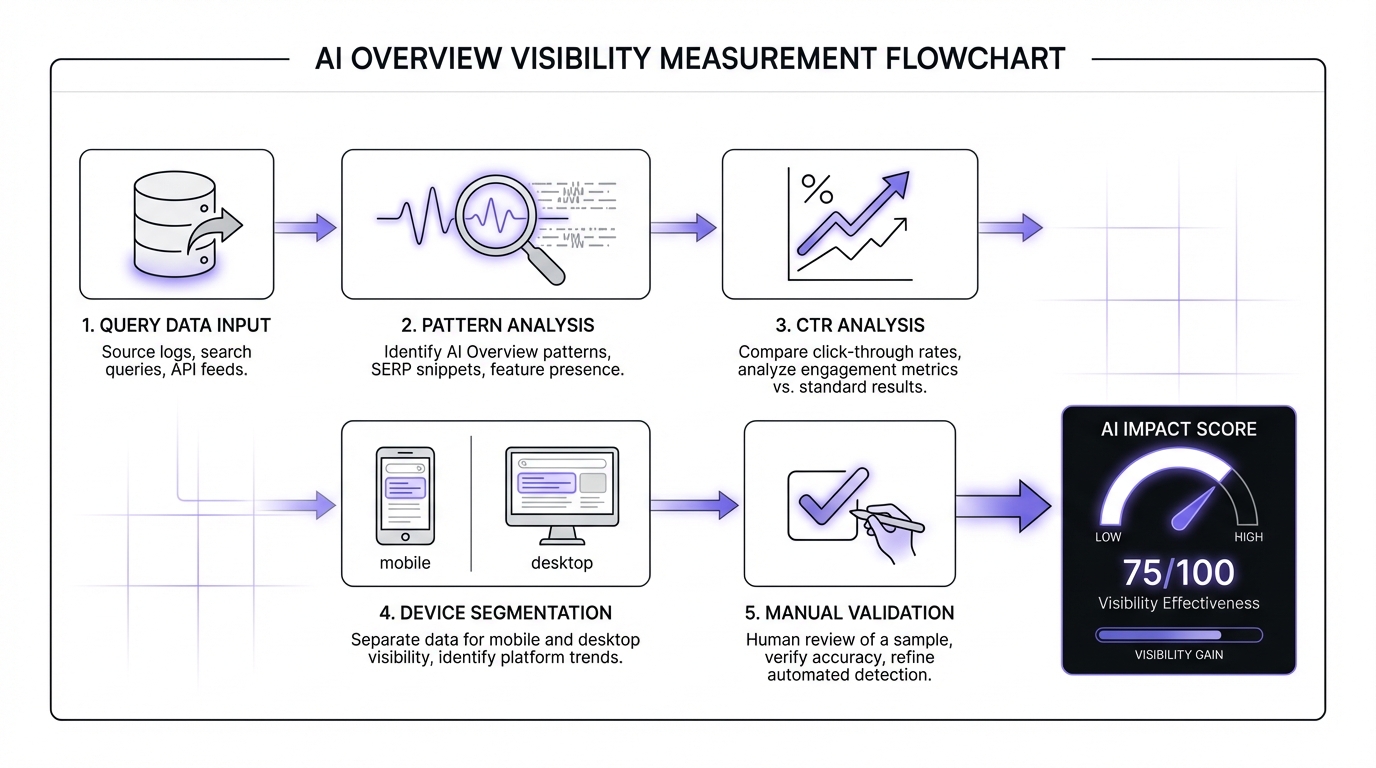
The Workaround Strategy
Since we can't get direct AI Overview metrics from GSC, we need to use indirect measurement techniques:
1. Query Pattern Analysis Identify queries likely to trigger AI Overviews based on query type, structure, and intent.
2. CTR Pattern Analysis Use CTR depression at high positions as a signal that AI Overviews are appearing and potentially reducing click-through.
3. Device and Geographic Segmentation Leverage the mobile-first rollout pattern to compare affected vs. less-affected segments.
4. Manual Competitive Benchmarking Spot-check actual search results to validate quantitative findings and track citation frequency.
What to Expect from Google
Industry speculation and Google's historical patterns suggest we may eventually see:
- An "AI Overview" impression type filter in GSC
- Citation tracking (similar to how Featured Snippets were tracked)
- Click data specifically for AI Overview source links
- AI Overview appearance trends over time
When this might happen: Based on Google's history with Featured Snippets (which took 2-3 years to get dedicated reporting), we might see AI Overview metrics in GSC by late 2026 or 2027.
Why build your methodology now: Having baseline data before Google adds official reporting gives you longer-term trend analysis and proves ROI on optimization efforts. The methodology you build today will integrate seamlessly with future native reporting.
Step 1: Identify Queries Likely Showing AI Overviews
The foundation of tracking AI Overview visibility is identifying which of your queries are likely triggering AI Overviews. While we can't know with 100% certainty without checking each query manually, we can use query patterns to create a probabilistic model.
Query Pattern Analysis
Through extensive testing and monitoring, certain query patterns consistently trigger AI Overviews:
High-probability AI Overview triggers:
- "How to..." queries (e.g., "how to improve SEO rankings")
- "What is..." and "What are..." queries (e.g., "what is domain authority")
- "Best..." queries (e.g., "best SEO tools for agencies")
- Comparison queries with "vs" (e.g., "Ahrefs vs Semrush")
- "Guide to..." queries (e.g., "guide to technical SEO")
- Long-tail informational queries (e.g., "why did my rankings drop suddenly")
Low-probability AI Overview triggers:
- Transactional queries with "buy" or "purchase"
- Branded navigational queries (e.g., "Google Search Console login")
- Local queries with geographic modifiers
- Current events and real-time information
- Product model numbers and specific SKUs
| Query Type | Example | AI Overview Likelihood |
|---|---|---|
| How-to | "how to improve SEO rankings" | High (80%+) |
| What-is | "what is domain authority" | High (80%+) |
| Best/Top | "best SEO tools for agencies" | High (70%+) |
| Comparison | "Ahrefs vs Semrush" | High (70%+) |
| Guide | "guide to technical SEO" | Medium-High (60%+) |
| Transactional | "buy SEO software" | Low (<20%) |
| Navigational | "Google Search Console login" | Low (<10%) |
| Local | "SEO agency near me" | Low (<20%) |
| Real-time | "latest Google algorithm update" | Low (<30%) |
| Product SKU | "SE Ranking PRO plan pricing" | Low (<15%) |
Using GSC Performance Report
Let's walk through the process of exporting and analyzing your query data.
Step 1: Navigate to the Performance Report
- Open Google Search Console
- Select your property
- Click "Performance" in the left sidebar
- Ensure you're on the "Search results" tab
Step 2: Set Your Date Range
- For initial baseline analysis: Last 28 days
- For trend analysis: Last 16 months (maximum available)
- For seasonal businesses: Compare same period year-over-year
Step 3: Configure Columns Click "Queries" tab if not already selected. Ensure these metrics are visible:
- Total clicks
- Total impressions
- Average CTR
- Average position
Step 4: Export Your Data Click the export icon (top right) and select "Download CSV" or open in Google Sheets.
Filtering Your Query List
Now comes the analysis. You have three methods to choose from based on your technical comfort level and query volume.
Method 1: GSC Regex Filtering (Recommended)
The most efficient method is using GSC's built-in regex filtering.
Step-by-step:
- In the GSC Performance Report, click the "Queries" tab
- Click the filter icon at the top of the queries list
- Select "Custom (regex)"
- Enter this pattern:
how to|what is|what are|best|vs|compared|guide to|why|when to - Click "Apply"
This filter will show only queries matching these informational patterns. Note the total impressions—this represents your "AI-likely" query volume.
Advanced regex patterns:
- For more precision:
^(how to|what is|what are)\s(Only matches queries starting with these phrases) - For product comparisons:
\svs\s|\sversus\s|\scompared to\s(Isolates comparison queries)
Method 2: Spreadsheet Formula Analysis
If you prefer working in spreadsheets or need more flexibility:
Step 1: Export queries to Google Sheets Use the GSC export function to send data directly to Sheets.
Step 2: Create categorization formula In a new column (let's say column E, assuming data starts in column A), add:
=IF(OR(REGEXMATCH(LOWER(A2),"how to"),REGEXMATCH(LOWER(A2),"what is"),REGEXMATCH(LOWER(A2),"what are"),REGEXMATCH(LOWER(A2),"best"),REGEXMATCH(LOWER(A2)," vs "),REGEXMATCH(LOWER(A2),"guide to")),"AI-Likely","Other")
Step 3: Drag formula down Apply this formula to all rows in your query list.
Step 4: Create pivot analysis Use a pivot table to sum impressions by category:
- Rows: Category (AI-Likely vs Other)
- Values: SUM of Impressions, SUM of Clicks, AVERAGE of CTR
Method 3: Manual Keyword Filtering
For smaller sites or initial exploration:
- Sort queries by impressions (highest first)
- Manually scan for informational patterns
- Use Sheets' filter function to show rows containing "how to"
- Repeat for each pattern keyword
- Tag or highlight AI-likely queries
This method is time-consuming but helps you develop intuition for your query patterns.
Creating Your "AI-Likely Query List"
Once you've categorized your queries, calculate these baseline metrics:
Primary metric: AI Exposure Percentage
AI Exposure % = (Impressions from AI-Likely Queries ÷ Total Impressions) × 100
Example: If you have 50,000 total impressions and 21,000 come from AI-likely queries, your AI exposure is 42%.
What this tells you:
- Under 20%: Low AI exposure—AI Overviews aren't your primary concern yet
- 20-40%: Moderate exposure—worth monitoring and optimizing strategically
- 40-60%: High exposure—AI Overviews significantly impact your traffic profile
- Over 60%: Very high exposure—urgent need for optimization and diversification
Save your analysis:
- Create a Google Sheet called "AI Overview Tracking - [Your Site]"
- Tab 1: "Query Classification" with your categorized query list
- Tab 2: "Baseline Metrics" with AI Exposure % and date recorded
- You'll add more tabs as we progress through the methodology
Important Caveats
Before we move forward, understand the limitations of this approach:
This is probabilistic, not definitive A "how to" query might not trigger an AI Overview, and a query without these patterns might still trigger one. We're working with high-probability indicators, not certainties.
AI Overview triggering changes over time Google continuously adjusts which queries show AI Overviews based on user behavior, content quality, and algorithmic refinements.
Geographic and personalization factors AI Overview appearance can vary by location, search history, and user preferences. Your results may differ from your users' experiences.
Use for trend analysis The real value isn't in absolute precision—it's in tracking directional changes over time. If your AI exposure increases from 35% to 45%, that's a meaningful trend regardless of absolute accuracy.
Step 2: Analyze CTR Patterns for AI Impact
Once you've identified your AI-likely queries, the next step is analyzing click-through rate patterns. CTR depression at high positions is a strong indicator that AI Overviews are appearing and satisfying query intent before users click through.
Understanding the CTR Signal
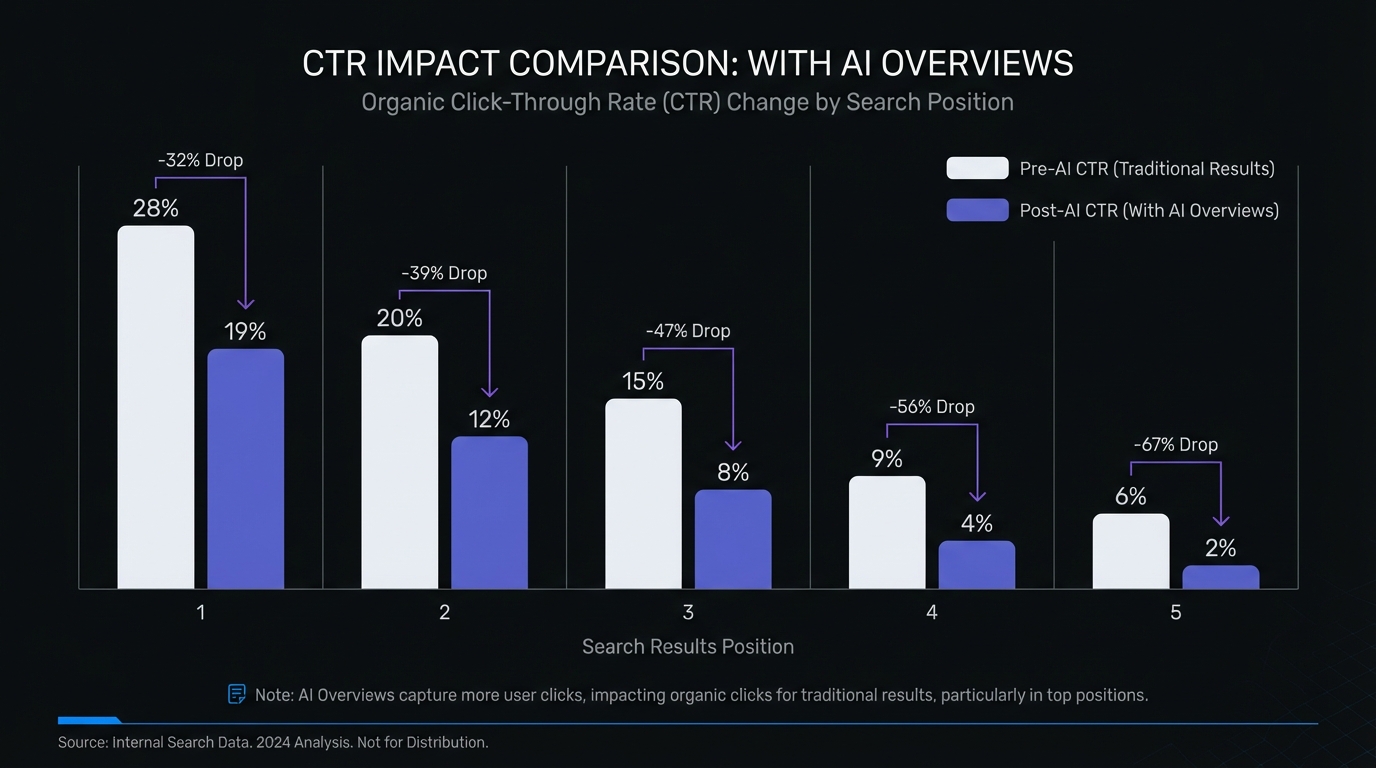
Click-through rate varies by position, but AI Overviews have dramatically changed the expected CTR benchmarks.
Historical CTR benchmarks (pre-AI Overviews):
- Position 1: 28-35%
- Position 2: 15-20%
- Position 3: 10-14%
- Position 4-10: 5-10%
Current CTR with AI Overviews (2026 observations):
- Position 1: 15-25% (when AI Overview present)
- Position 2: 10-15%
- Position 3: 7-12%
- Position 4-10: 4-8%
The CTR reduction is most dramatic for position 1, where AI Overviews push results below the fold on mobile devices. Recent research quantifies this impact: Position 1 CTR dropped 32% (from 28% to 19%), while Position 2 fared even worse with a 39% decline. Zero-click searches now account for 60% of all searches, projected to exceed 70% in 2025.
How GSC Counts AI Overview Impressions
Before analyzing CTR, understand how Google Search Console actually counts impressions for AI Overview citations. Not all citations are treated equally—there's a three-tier visibility system:
Tier 1: Visible Citations (Above Fold) Citations displayed immediately when the AI Overview loads trigger an impression as soon as the user sees the search results. These are the most valuable positions, typically the first 2-3 sources.
Tier 2: Partially Visible Citations (Scroll Required) Citations that require scrolling within the AI Overview to view only trigger an impression when the user scrolls them into view. Position matters less than user behavior here.
Tier 3: Hidden Citations (Behind "Load More") Many AI Overviews collapse additional sources behind a "Show more" or expansion link. These citations only trigger impressions when a user actively expands the section.
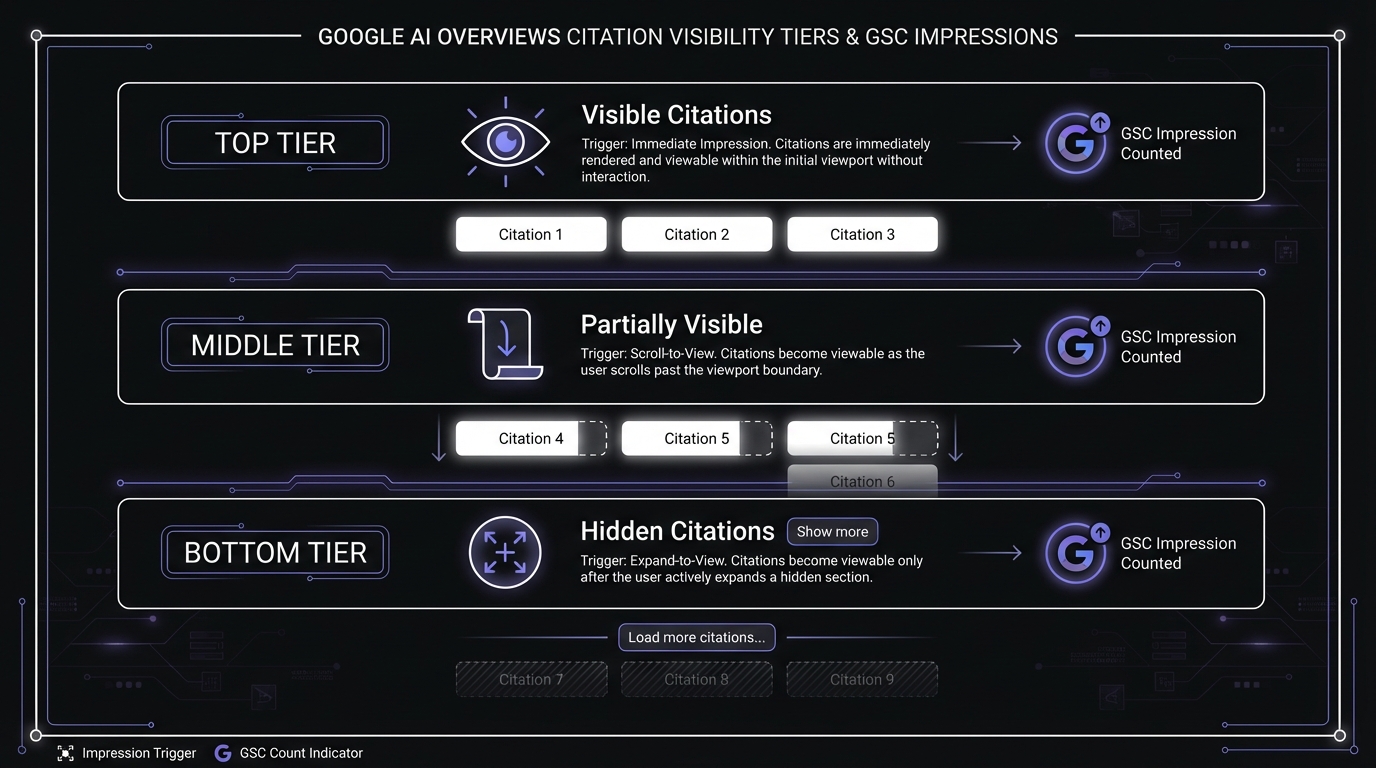
Why this matters for your tracking:
- All URLs within an AI Overview share the same position ranking in GSC (typically position 1)
- You might have high impressions but low CTR because users saw your citation without clicking
- Hidden citations receive far fewer impressions than visible ones, even for identical queries
- Tracking citation position within the AI Overview matters as much as presence
Setting Up CTR Baseline
Let's establish your current CTR performance for AI-likely queries.
Step 1: Filter for AI-Likely Queries In GSC Performance Report, apply the regex filter from Step 1 to show only AI-likely queries.
Step 2: Add Position Filter Click "Add filter" → "Position" → "Queries where position is less than 10" This focuses on queries where you rank highly enough to potentially benefit from clicks.
Step 3: Analyze CTR by Position Unfortunately, GSC doesn't show CTR by position in a table format, so you'll need to export data and analyze in spreadsheets.
In Google Sheets:
- Export your filtered query data
- Create position buckets: Use formula
=IF(E2<=1,"Pos 1",IF(E2<=3,"Pos 2-3",IF(E2<=5,"Pos 4-5","Pos 6-10"))) - Create pivot table:
- Rows: Position bucket
- Values: AVERAGE of CTR, COUNT of queries
Document your baseline:
- Average CTR for AI-likely queries at position 1-3: __%
- Average CTR for non-AI queries at position 1-3: __%
- CTR gap (difference between the two): __percentage points
- Date of baseline measurement: ____
Time-Based CTR Analysis
The most powerful insight comes from tracking CTR changes over time for the same queries at similar positions.
Using GSC's Compare Dates Feature:
Step 1: Set up comparison
- In GSC Performance Report, click the date selector
- Choose "Compare" tab
- Set comparison periods:
- Period 1: Last 28 days (current)
- Period 2: 28 days from 1 year ago (seasonal comparison)
- OR: 28 days from 6 months ago (recent trend)
Step 2: Apply filters
- Queries: Custom regex for AI-likely patterns
- Position: Less than 10
Step 3: Sort by CTR difference Click the CTR column header to sort by change. Look for:
- Queries with stable positions but declining CTR
- Consistent patterns across multiple queries
- Magnitude of change (5+ percentage point drops are significant)
What to look for:
- Red flag: Position 1-2 query with CTR drop from 28% → 16% (likely AI Overview impact)
- Green flag: Position 1-2 query with CTR holding at 25-30% (likely no AI Overview, or you're cited)
- Mixed signal: Position improvement but CTR still declining (AI Overview appearing more frequently)
Query-Level CTR Deep Dive
Some individual queries provide especially clear signals of AI Overview impact.
Identify high-signal queries:
Queries with these characteristics strongly indicate AI Overview presence:
- High impression volume (1,000+ impressions per month)
- Top 3 position (average position 1.0-3.0)
- Low CTR (below 20% for position 1-3)
Real example analysis:
Query: "how to fix broken links in SEO" Impressions: 2,400/month Position: 1.2 CTR: 14.3%
Analysis: Expected CTR for position 1.2 is 28-32%. Actual CTR of 14.3% represents a 50% reduction. High-confidence indicator that an AI Overview appears for this query and satisfies most user intent before they click through.
Manual verification: Search this query in Google (incognito mode) to confirm AI Overview presence and check if you're cited as a source.
Creating a CTR Monitoring Dashboard
Now let's build a simple tracking system to monitor these metrics over time.
Dashboard structure in Google Sheets:
Tab 1: Weekly CTR Snapshot
| Week Ending | AI-Likely CTR (Pos 1-3) | Non-AI CTR (Pos 1-3) | CTR Gap | AI-Likely Impressions | Notes |
|---|---|---|---|---|---|
| 2026-01-21 | 17.2% | 26.8% | 9.6% | 21,000 | Baseline |
Tab 2: High-Signal Queries
| Query | Position | CTR | Impressions | Last Checked | AI Overview Present? | Cited? |
|---|
Tab 3: Charts
- Line chart: CTR trend over time (AI-likely vs Non-AI)
- Bar chart: CTR gap over time
- Area chart: AI-likely impression share over time
Updating frequency:
- Weekly: Update Tab 1 with current week's metrics (takes 5-10 minutes)
- Monthly: Deep dive into Tab 2, add newly high-signal queries, remove resolved ones
- Quarterly: Full analysis with annotations and strategic implications
Why frequent updates matter: Semrush research found that 91% of AI Overviews changed the domains they linked to over a 90-day period. The sources cited in AI answers are highly volatile—your visibility today doesn't guarantee visibility tomorrow. Weekly tracking catches these shifts before they compound into significant traffic losses.
Step 3: Device and Geographic Segmentation
AI Overviews rolled out gradually, with mobile-first deployment and phased geographic availability. This creates natural comparison groups we can use to validate AI impact.
Mobile vs Desktop Analysis
Since AI Overviews appeared on mobile searches before desktop (and appear more frequently on mobile even now), comparing device performance reveals AI impact.
Step 1: Add device segmentation to GSC
- In Performance Report, click "Add filter"
- Select "Device"
- Choose "Mobile"
- Note your AI-likely query CTR metrics
Step 2: Repeat for Desktop
- Change filter to "Device: Desktop"
- Note your AI-likely query CTR metrics
Step 3: Calculate device CTR gap
Device CTR Gap = Mobile CTR for AI-Likely Queries - Desktop CTR for AI-Likely Queries
What the gap tells you:
- Gap of -5 to -15 percentage points: Typical AI Overview mobile impact
- Gap near zero: Either minimal AI Overview presence or similar impact across devices
- Gap widening over time: AI Overviews expanding to more queries on mobile
Real example:
Site: SEO blog AI-Likely Queries, Position 1-3:
- Mobile CTR: 15.3%
- Desktop CTR: 24.7%
- Gap: -9.4 percentage points
Interpretation: Strong evidence of mobile AI Overview impact. Desktop CTR is closer to historical norms, suggesting AI Overviews appear less frequently or are less prominent on desktop for these queries.
Geographic Segmentation
AI Overviews launched in the United States first, then expanded to other English-speaking countries, then globally. Geographic comparison can reveal rollout patterns and future impact.
Step 1: Filter by country
- In GSC, click "Add filter" → "Country"
- Select your primary market (e.g., United States)
- Document CTR metrics
Step 2: Compare with secondary markets
- Change filter to a different country (e.g., United Kingdom, Canada)
- Compare CTR for same query patterns
Step 3: Identify rollout lag If CTR is significantly higher in a market that received AI Overviews later, you can estimate the trajectory for that market based on your experience in early-rollout markets.
What These Segments Tell You
Strong AI impact indicator:
- Mobile CTR 8-12 points lower than desktop
- US CTR 6-10 points lower than other English markets
- CTR gaps widening month-over-month
Weak or no AI impact indicator:
- Mobile and desktop CTR within 3 points of each other
- Geographic CTR relatively consistent
- CTR stable over time
Use these insights to:
- Validate your query-based AI-likely categorization
- Quantify device-specific impact for mobile-first indexing decisions
- Predict future impact in markets where AI Overviews are just launching
- Justify optimization resources based on concrete evidence of impact
Step 4: Competitive Benchmarking and Manual Verification
Quantitative GSC analysis gives you scale and trends, but qualitative manual checking provides ground truth. You need to verify that your assumptions about AI Overview presence are correct and understand whether you're being cited.
Manual AI Overview Checks
Setting up your spot-check process:
Step 1: Select queries for manual checking From your high-signal query list (high impressions, top 3 position, low CTR), select 20-30 queries representing:
- Different query types (how-to, what-is, best, comparison)
- Different traffic volumes (high, medium, low)
- Different content types on your site (guides, comparisons, tools)
Step 2: Create tracking spreadsheet
| Query | Position (GSC) | CTR (GSC) | AI Overview Present? | Cited as Source? | Source Position | Date Checked | Notes |
|---|---|---|---|---|---|---|---|
| how to track ai overview visibility | 1.3 | 16.2% | Yes | Yes | 2nd source | 2026-01-21 | Positive mention |
Step 3: Perform manual searches
- Use incognito/private browsing mode
- Use VPN if checking international markets
- Search from mobile AND desktop
- Take screenshots for documentation
- Note any variations in AI Overview content or sources
Step 4: Document findings For each query, record:
- AI Overview presence (Yes/No)
- Your citation status (Yes/No/Partial - if mentioned but not linked)
- Source position if cited (1st, 2nd, 3rd, 4th+)
- Quality of citation (directly attributed, paraphrased, context)
Citation Frequency Analysis
Once you've checked 20-30 queries, calculate your citation metrics.
Primary metric: Citation Rate
Citation Rate = (Queries Where You're Cited ÷ Queries With AI Overview) × 100
Example:
- 30 queries checked
- 25 showed AI Overviews
- 6 cited your content
- Citation Rate: 6 ÷ 25 = 24%
Benchmarks:
- 0-10%: Low authority for these queries—E-E-A-T optimization needed
- 10-25%: Moderate authority—selective optimization opportunities
- 25-40%: Strong authority—focus on maintaining and expanding
- 40%+: Exceptional authority—you're a dominant source (rare)
Secondary metric: Source Position Quality Of citations, what percentage are in the top 2 sources vs. 3rd+ position?
Top Source Rate = (Citations as 1st or 2nd Source ÷ Total Citations) × 100
Higher source positions receive more visual prominence in AI Overviews and likely drive more brand awareness.
Source Position in AI Overview
Not all citations are equal. AI Overviews typically show 3-6 sources, with the first 2-3 receiving significantly more visibility.
What source position indicates:
- 1st source: Often includes the most prominent quote or forms the basis of the AI Overview's answer
- 2nd-3rd source: Supporting details, alternative perspectives, or specific data points
- 4th+ source: Additional context, less visually prominent (sometimes requires expansion to see)
Track position trends: If you're consistently appearing as 4th+ source, there's optimization opportunity to move up. If you're consistently 1st-2nd, you're in a strong position.
Setting Up Periodic Manual Checks
Manual checking is time-intensive, so be strategic about cadence.
Recommended schedule:
Weekly (10-15 minutes):
- Spot-check 5-10 of your top traffic queries
- Look for significant changes (new AI Overviews appearing, citation losses)
- Document anomalies for deeper investigation
Monthly (45-60 minutes):
- Check full list of 20-30 high-signal queries
- Update citation rates and source positions
- Identify optimization opportunities based on citation patterns
- Document any new query patterns triggering AI Overviews
Quarterly (2-3 hours):
- Expand check to 50-75 queries across all categories
- Analyze citation patterns by content type
- Full competitive analysis (who else is being cited?)
- Update strategic priorities based on comprehensive data
Pro tip: Set Google Calendar reminders for your checking schedule to maintain consistency.
Third-Party Tools for AI Overview Tracking
While the GSC-based methodology is free and accessible to everyone, third-party tools offer automation, scale, and additional insights. Here's what's available and when it's worth the investment.
Semrush AI Overview Visibility Report
What it offers:
- Automated tracking of AI Overview appearance for your tracked keywords
- Citation frequency and source position monitoring
- Competitive comparison (who else is being cited)
- Historical trend data
- AI Overview appearance forecasting
How to access:
- Navigate to Position Tracking project
- Select "AI Overviews" tab (rolled out Q4 2025)
- View AI Overview appearance rates and citation metrics
Pros:
- Fully automated—no manual checking required
- Scales to thousands of keywords
- Daily updates
- Visual trend charts and reports
- Competitive intelligence included
Cons:
- Requires Semrush subscription ($129+/month for features)
- Limited to keywords you're actively tracking (quota limits)
- Some lag in detecting new AI Overview appearances (24-48 hours)
- Doesn't capture all the nuance of manual checks
Best for: Agencies, in-house teams managing multiple sites, or sites with large keyword portfolios (500+ primary keywords).
BrightEdge AI Visibility Score
What it offers:
- Proprietary "AI Visibility Score" combining multiple signals
- Enterprise-level tracking across entire content portfolio
- Integration with broader content performance metrics
- AI readiness scoring for individual pages
- Predictive modeling for AI impact
How it works: BrightEdge analyzes your content's structure, authority signals, topic coverage, and current search performance to generate an AI visibility score and recommendations.
Pros:
- Most sophisticated AI Overview tracking currently available
- Holistic view of AI search performance
- Actionable optimization recommendations
- Executive-level reporting and dashboards
- Dedicated customer success support
Cons:
- Enterprise pricing (typically $10,000+/year)
- Significant implementation and onboarding time
- Complexity may be overkill for small sites
- Long contract commitments
Best for: Enterprise organizations with substantial SEO budgets, large content teams, and complex multi-site portfolios.
Ahrefs and Other Major SEO Tools
As of January 2026, most major SEO platforms are developing AI Overview tracking features:
Ahrefs: Beta AI Overview appearance tracking in Site Explorer (select accounts) Moz: Announced AI visibility metrics coming in 2026 Pro plans Rank Ranger: AI Overview SERP feature tracking in beta
What to expect in 2026:
- All major SEO platforms will likely add basic AI Overview tracking
- Features will vary in sophistication and accuracy
- Most will require higher-tier subscriptions
- Early adoption may have bugs and limitations
Recommendation: If you already subscribe to a major SEO platform, check for AI Overview features and test them against your GSC methodology. Don't switch tools solely for AI tracking until features mature (6-12 months from release).
Custom Tracking Solutions
For sites with specific needs or technical resources, custom tracking solutions offer maximum flexibility.
Approach 1: Google Cloud Search API
- Programmatically perform searches for your keywords
- Parse SERP HTML to detect AI Overview presence and content
- Store results in database for trend analysis
- Automate citation checking
Pros: Complete control, can track unlimited queries, custom metrics Cons: Requires development resources, ethical/legal considerations around automated searching, maintenance overhead
Approach 2: SERP API Services
- Services like SerpAPI, Bright Data SERP API, or ScaleSerp
- Provide structured SERP data including AI Overview content
- Pay-per-request or subscription pricing
- Integration via API
Pros: Easier than building from scratch, structured data, scalable Cons: Ongoing costs, still requires custom development for analysis layer
When custom solutions make sense:
- Large sites (10,000+ keywords to track)
- Unique tracking requirements not met by commercial tools
- Technical team with capacity to build and maintain
- Need for real-time monitoring and alerting
Tool Comparison and Recommendations
| Method | Cost | Setup Time | Maintenance | Accuracy | Scale | Best For |
|---|---|---|---|---|---|---|
| GSC Manual | Free | 2-4 hours | 1-2 hrs/month | Good* | 20-50 queries | Small sites, budget-conscious |
| GSC + Sheets Dashboard | Free | 4-6 hours | 30 min/week | Good* | 50-200 queries | Most small-medium sites |
| Semrush | $129+/mo | 1-2 hours | Minimal | Very Good | 500-5,000 queries | Agencies, growing sites |
| BrightEdge | $10k+/yr | 2-4 weeks | Minimal | Excellent | Unlimited | Enterprise |
| Custom Solution | $5k-50k | 4-12 weeks | 10-20 hrs/month | Excellent | Unlimited | Large technical organizations |
*Accuracy for manual methods depends on sample size and consistency of checking.
Decision framework:
- Start with GSC methodology (everyone)—it's free and teaches you the fundamentals
- Upgrade to Semrush if you're tracking 200+ keywords and have budget
- Consider BrightEdge if you're enterprise-scale with dedicated SEO team
- Build custom only if you have specific needs unmet by commercial tools
Hybrid approach (recommended):
- Use GSC methodology for monthly deep dives and strategic analysis
- Use paid tool for automated daily monitoring of key queries
- Manual spot checks to validate automated findings
- Combine insights for most complete picture
Creating Your AI Overview Tracking Dashboard
Now let's bring everything together into a comprehensive tracking dashboard that monitors your AI Overview visibility over time.
Dashboard Components
A well-designed AI Overview tracking dashboard should include three categories of metrics:
Primary Metrics (updated weekly):
- AI Exposure Percentage: What percentage of your impressions come from AI-likely queries?
- AI-Likely Query CTR (Pos 1-3): Average CTR for your top-ranking AI-likely queries
- CTR Gap: Difference between AI-likely and non-AI query CTR
- Citation Rate: Percentage of checked queries where you're cited in AI Overview
Trend Metrics (tracked over time):
- Week-over-week change: Did metrics improve or decline?
- Month-over-month change: Longer-term trend direction
- Quarterly comparison: Seasonal adjustments and major shifts
- Year-over-year: Annual progress on optimization efforts
Segmentation Metrics (updated monthly):
- Mobile vs Desktop CTR: Device-specific AI impact
- Geographic variations: Market-by-market performance
- Content type performance: Which content is most/least cited?
- Query type breakdown: How-to vs what-is vs best vs comparison performance
Google Sheets Dashboard Setup
Here's how to build a functional tracking dashboard using Google Sheets.
Step 1: Create Dashboard Spreadsheet Structure
Create a new Google Sheet with these tabs:
- Dashboard (your main view with charts and current metrics)
- Weekly Data Entry (simple data input from GSC each week)
- Query Classification (your master query list with categories)
- Manual Checks Log (record of spot-check findings)
- Calculations (formulas and derived metrics)
Step 2: Build Data Input Tab (Weekly Data Entry)
Set up a simple table for weekly data entry:
| Week Ending | Total Impressions | AI-Likely Impressions | AI-Likely Clicks | AI-Likely Pos 1-3 CTR | Non-AI Pos 1-3 CTR | Mobile CTR | Desktop CTR |
|---|---|---|---|---|---|---|---|
| 2026-01-21 | 50,000 | 21,000 | 3,612 | 17.2% | 26.8% | 15.3% | 24.7% |
Where to get these numbers:
- Filter GSC by your AI-likely regex, note impressions and clicks
- Filter further for position 1-3, calculate CTR
- Repeat without AI filter for non-AI CTR
- Add device filters for mobile/desktop CTR
Step 3: Build Calculation Formulas
In the Calculations tab, create derived metrics:
// AI Exposure Percentage
=IFERROR(WeeklyData!C2/WeeklyData!B2,0)

// CTR Gap
=WeeklyData!E2-WeeklyData!F2

// Week-over-Week Change
=(WeeklyData!E2-WeeklyData!E3)/WeeklyData!E3

// 4-Week Moving Average
=AVERAGE(WeeklyData!E2:E5)
Step 4: Create Visualization Charts
On the Dashboard tab, create these charts:
Chart 1: AI-Likely CTR Trend (Line Chart)
- X-axis: Week Ending dates
- Y-axis: AI-Likely CTR percentage
- Add 4-week moving average trendline
- Set Y-axis scale: 0-40% for better visualization
Chart 2: CTR Gap Over Time (Bar Chart)
- X-axis: Week Ending dates
- Y-axis: CTR Gap (percentage points)
- Color-code: Red for large gaps (>10pts), yellow for moderate (5-10pts), green for small (<5pts)
Chart 3: AI Exposure Trend (Area Chart)
- X-axis: Week Ending dates
- Y-axis: Percentage of impressions
- Two areas: AI-Likely (orange) and Non-AI (blue)
- Stacked to show composition over time
Chart 4: Citation Rate Progress (Combo Chart)
- X-axis: Month
- Left Y-axis: Citation Rate percentage
- Right Y-axis: Number of queries checked
- Line: Citation rate trend
- Bars: Sample size by month
Step 5: Set Up Conditional Formatting
Apply conditional formatting to highlight changes requiring attention:
Alert conditions:
- CTR Gap increases by >3 percentage points week-over-week → Red background
- AI Exposure Percentage increases by >5% month-over-month → Orange background
- Citation Rate drops by >10% month-over-month → Red background
- Week-over-week CTR improves by >2 percentage points → Green background
Step 6: Add Current Metrics Summary
At the top of your Dashboard tab, create a metrics summary card:
┌─────────────────────────────────────────┐
│ AI OVERVIEW TRACKING DASHBOARD          │
│ Last Updated: 2026-01-21                │
├─────────────────────────────────────────┤
│ AI Exposure: 42.0% (↑1.2% vs last week) │
│ AI-Likely CTR: 17.2% (↓0.3% vs last wk) │
│ CTR Gap: 9.6 pts (↑0.8 pts vs last wk)  │
│ Citation Rate: 24.0% (15 of 25 checked) │
└─────────────────────────────────────────┘
Use formulas to pull the most recent week's data and calculate changes automatically.
Download template: [Link to downloadable Google Sheets template]
Setting Up Alerts
Google Sheets can send email notifications when values change significantly.
Setting up notification rules:
- Click "Tools" → "Notification rules"
- Select the "Calculations" tab
- Set rules for key metrics cells:
- "Notify me when: A cell value changes to: [formula detecting >10% change]"
- "Notify me at: [Your email], Daily digest"
Example alert formula:
=IF(ABS((CurrentWeekCTR-LastWeekCTR)/LastWeekCTR)>0.1,"ALERT: Major CTR Change","")
Place this in a cell and set notification on that cell changing to non-empty.
Reporting Cadence
Establish a consistent rhythm for dashboard updates and analysis.
Weekly (Monday morning, 10 minutes):
- Export previous week's GSC data
- Enter metrics into Weekly Data Entry tab
- Quick scan of dashboard for major changes
- Note any alerts or unusual patterns
Monthly (First Friday of month, 45-60 minutes):
- Perform manual check of 20-30 key queries
- Update citation rates and source positions
- Write brief analysis: What changed? Why? What actions needed?
- Share dashboard with stakeholders
Quarterly (First week of quarter, 2-3 hours):
- Comprehensive analysis of trends
- Competitive benchmarking (check what competitors are doing)
- Update query classification (new AI-likely patterns emerging?)
- Strategic planning: Prioritize optimization efforts for next quarter
- Present findings to leadership with recommendations
Annual (January, strategic planning):
- Full year retrospective: What worked? What didn't?
- Recalibrate baselines and benchmarks
- Set goals for AI visibility for the year
- Budget allocation for optimization resources
Interpreting Your Data and Taking Action
Data without action is just numbers. Here's how to interpret your dashboard metrics and respond appropriately.
Scenario 1: High AI Exposure, Low Citation Rate
Indicators:
- AI Exposure: 45%+
- Citation Rate: <15%
- CTR Gap: 10+ percentage points
What it means: A large portion of your traffic comes from queries that trigger AI Overviews, but you're rarely cited as a source. This is the highest-risk scenario—you're losing traffic without gaining brand awareness benefits.
Action plan:
- Immediate (Week 1-4): Audit E-E-A-T signals for top 20 AI-likely query landing pages
- Add author bios with credentials
- Include citations to authoritative sources in your content
- Implement proper schema markup (Article, FAQ, HowTo)
- Short-term (Month 2-3): Content optimization sprint
- Rewrite/enhance content for top 50 AI-likely queries
- Focus on comprehensive, authoritative coverage
- Add unique insights, original data, expert perspectives
- [Link to parent pillar: Adapting to AI Search optimization strategies]
- Medium-term (Month 4-6): Authority building
- Pursue high-quality backlinks to these pages
- Build topical authority with supporting cluster content
- Establish thought leadership through original research
Timeline to results: 3-6 months to see meaningful improvement in citation rates
Success metrics:
- Citation Rate increases to 20-25%+
- CTR Gap narrows by 2-3 percentage points
- Some queries show new citations in manual checks
Scenario 2: High AI Exposure, High Citation Rate
Indicators:
- AI Exposure: 40%+
- Citation Rate: 30%+
- CTR Gap: 8-10 percentage points
What it means: You're frequently cited in AI Overviews, demonstrating strong authority. However, CTR is still impacted. This is a "winning despite headwinds" scenario.
Action plan:
- Immediate: Focus on CTR optimization for AI-likely queries
- Optimize title tags to stand out below AI Overviews
- Test meta descriptions emphasizing unique value ("Plus: exclusive data...")
- Add publication/update dates to show freshness
- Short-term: Brand building initiatives
- You're getting brand exposure through citations—capitalize on it
- Retargeting campaigns for users exposed to your brand in AI Overviews
- Social proof elements (testimonials, case studies, credentials)
- Medium-term: Content differentiation
- Create content that can't be summarized in AI Overview
- Interactive tools, calculators, templates
- Original research, proprietary data
- In-depth analysis and expert perspective
Timeline to results: 1-3 months for CTR improvements, ongoing for brand building
Success metrics:
- Maintain high citation rate (30%+)
- CTR improves by 2-3 percentage points
- Direct/branded traffic increases (indirect measurement of brand awareness from citations)
Scenario 3: Low AI Exposure
Indicators:
- AI Exposure: <25%
- Citation Rate: Variable (less critical)
- CTR Gap: <5 percentage points
What it means: Most of your traffic comes from queries that don't trigger AI Overviews, or you're in industries/query types less affected. You're relatively insulated from AI Overview impact.
Action plan:
- Immediate: Monitor, don't panic
- Continue tracking to detect changes
- Document current baseline for future comparison
- Short-term: Prepare proactively
- Audit E-E-A-T signals as preventive measure
- Implement structured data
- Ensure content quality standards are high
- Medium-term: Strategic positioning
- Gradually shift content mix toward topics building authority
- Diversify traffic sources regardless
- Position for future as AI Overviews expand to more query types
Timeline: Ongoing vigilance; no urgent action required
Success metrics:
- AI Exposure remains stable or decreases
- CTR maintains historical norms
- Prepared for future changes
Scenario 4: Increasing AI Exposure Over Time
Indicators:
- AI Exposure growing month-over-month (30% → 35% → 40%)
- CTR Gap widening
- New query patterns showing AI Overviews
What it means: Google is expanding AI Overviews to more of your query space. This is a leading indicator that impact will grow unless you adapt.
Action plan:
- Immediate: Accelerate optimization timeline
- Don't wait—Google is moving your queries into AI territory
- Prioritize E-E-A-T optimization for newly affected queries
- Short-term: Proactive content strategy
- Identify queries not yet showing AI Overviews but likely to soon
- Pre-optimize these pages before AI Overviews appear
- Create new content targeting less-AI-affected query types
- Medium-term: Diversification strategy
- Reduce dependency on organic search
- Build email list, social following, direct audience
- [Link to parent pillar section on future-proofing]
Timeline: Immediate action; ongoing adaptation
Success metrics:
- AI Exposure growth slows or stabilizes
- Citation Rate for newly AI-affected queries starts strong (20%+)
- Diversified traffic sources show growth
Using Data to Prioritize Content Optimization
Not all content deserves equal optimization effort. Use an impact × opportunity matrix.
Quadrant 1: High Impact, High Opportunity (Priority 1)
- High-traffic AI-likely queries
- Currently low/no citations
- Position 1-5 (rankable)
- Action: Immediate comprehensive optimization
Quadrant 2: High Impact, Low Opportunity (Priority 3)
- High-traffic AI-likely queries
- Already highly cited (30%+ rate)
- Limited improvement potential
- Action: Maintain quality, focus on CTR optimization
Quadrant 3: Low Impact, High Opportunity (Priority 2)
- Medium-traffic AI-likely queries
- Low citations but improvable
- Strategic importance (growing topic)
- Action: Selective optimization, batch with similar queries
Quadrant 4: Low Impact, Low Opportunity (Priority 4)
- Low-traffic queries
- Limited citation potential
- Low strategic importance
- Action: Deprioritize or eliminate
Measuring Optimization Impact
Once you've optimized content, tracking improvement is crucial to justify continued investment.
Before/after comparison methodology:
-
Establish baseline (Week 0)
- Document current citation rate for optimized queries
- Record CTR for those queries
- Note average position
-
Wait period (Weeks 1-8)
- Allow Google to recrawl and reassess content
- Typical lag time: 4-8 weeks for citation changes
- Continue monitoring but don't expect immediate changes
-
Measure impact (Weeks 8-12)
- Perform manual check of optimized queries
- Compare citation rate: before vs. after
- Compare CTR trends for those specific queries
- Document improvements in tracking dashboard
Case study example:
Optimization project: Enhanced 15 "how-to" guides with improved E-E-A-T signals Baseline (Week 0): Citation rate: 13% (2 of 15 queries) 8 weeks post-optimization: Citation rate: 33% (5 of 15 queries) 12 weeks post-optimization: Citation rate: 40% (6 of 15 queries) CTR impact: Average CTR improved from 14.2% to 17.8% (+3.6 percentage points)
Conclusion: Optimization improved citation rate by 27 percentage points and partially recovered CTR losses. Estimated traffic improvement: +25% for these queries.
What metrics indicate successful optimization:
- Citation rate increases by 10+ percentage points
- CTR improves by 2-5 percentage points (even if still below historical norms)
- Source position improves (moving from 4th+ to 1st-3rd source)
- Queries maintain or improve rankings (position stays stable or improves)
Advanced Tracking Techniques
Once you've mastered the fundamentals, these advanced techniques provide deeper insights.
Tracking by Content Type
Different content types perform differently in AI Overviews. Segment your analysis to inform content strategy.
Content type classification:
- How-to guides: Step-by-step instructional content
- Comparison posts: "X vs Y" content
- List posts: "Best X" or "Top 10 X"
- Definitive guides: Comprehensive "ultimate guide to X"
- Quick answers: Short-form FAQ-style content
- Opinion/analysis: Expert perspective pieces
- Original research: Data studies, surveys, proprietary insights
In Google Sheets:
- Add "Content Type" column to your Query Classification tab
- Manually tag queries by the content type they lead to
- Create pivot table showing citation rates by content type
- Analyze: Which content types get cited most frequently?
Insights you'll gain:
- "Our comparison content has 45% citation rate vs. 18% for how-to guides"
- "Quick answer content shows AI Overviews 80% of the time but we're rarely cited"
- "Original research has 60% citation rate—expand this content type"
Strategic application: Double down on content types with high citation rates and consider reducing investment in types with poor performance that can't be improved.
Landing Page-Level Analysis
Instead of query-level tracking, analyze which pages on your site are most affected by AI Overviews.
In GSC:
- Go to Performance Report → "Pages" tab
- Click on a specific page URL
- View "Queries" for that page
- Apply your AI-likely regex filter
- Calculate: What % of this page's impressions come from AI-likely queries?
Create page-level dashboard:
| Page URL | Total Impressions | AI-Likely % | Avg CTR AI-Likely | Citation Rate | Priority |
|---|---|---|---|---|---|
| /guide-to-link-building | 12,000 | 68% | 14.2% | 20% | High |
| /local-seo-tips | 8,500 | 22% | 28.1% | N/A | Low |
Use this analysis to:
- Prioritize optimization by page value (traffic × conversion rate × AI impact)
- Identify pages that need urgent attention
- Celebrate wins (pages with high citation rates)
- Inform content creation (model new content after high-citation pages)
Brand Query Protection
Monitor branded queries separately to ensure AI Overviews aren't impacting your brand moat.
Brand query definition: Queries including your brand name, product names, or branded terms.
Tracking methodology:
- Create "Brand Queries" filter in GSC: Custom regex with your brand terms
- Track CTR for branded queries separately
- Monitor for AI Overview appearance in branded searches
- Alert threshold: Brand query CTR dropping below 60% (very concerning)
Why this matters: Branded queries should be largely protected from AI Overview impact because users are specifically looking for your site. If you see significant CTR drops in branded queries with AI Overviews appearing, it suggests:
- Brand confusion (Google uncertain you're the authority on your own brand)
- Competitors appearing in your branded AI Overviews
- Need for stronger brand signals (schema markup, knowledge panel optimization)
Emerging AI-Specific Metrics
Traditional SEO metrics (rankings, CTR, traffic) don't fully capture AI search performance. As AI Overviews mature, track these emerging metrics alongside your GSC methodology:
AI Brand Mention Rate: How often your brand appears in AI-generated answers (even without a link). Mentioned brands build awareness even when clicks don't happen.
Citation Quality Score: Not just if you're cited, but how—are you the primary source, a supporting reference, or buried behind "load more"?
Query Coverage Rate: What percentage of your target queries trigger AI Overviews where you could potentially be cited?
Semantic Relevance Score: How closely does your content align with the types of questions AI systems are answering?
Structured Data Completeness: AI systems rely heavily on structured data. Track your schema markup coverage and accuracy.
These metrics require manual tracking or specialized tools, but they provide insight beyond what GSC offers for understanding AI search performance.
Integration with Google Analytics 4
GSC shows you search behavior, but GA4 shows you what happens after the click. Connecting these reveals the full AI impact story.
Connection points:
-
Engagement quality by traffic source
- Compare engagement metrics (time, pages/session, conversions) for queries with high AI exposure vs. low
- Hypothesis: Users who click through despite AI Overview may be more engaged (they wanted more depth)
- Analysis: If engagement is actually higher for AI-affected queries, CTR loss may be offset by quality
-
Full-funnel attribution
- Track whether AI Overview citations contribute to later brand searches
- Multi-touch attribution showing AI Overview as "awareness" touchpoint
- Analysis may justify AI citations even when direct CTR is reduced
-
Landing page performance
- GA4 landing page report filtered by organic search traffic
- Compare conversion rates for pages with high vs. low AI exposure
- Insight: High-converting pages with AI exposure deserve priority optimization
Setup requirement: Link GSC and GA4 properties, use UTM parameters or custom dimensions to segment AI-likely vs. non-AI traffic for deeper analysis.
What's Coming: Future of AI Overview Measurement
The measurement landscape is evolving rapidly. Here's what to expect and how to prepare.
Potential GSC Updates
Based on Google's historical patterns with new SERP features, expect these updates eventually:
High probability (2026-2027):
- AI Overview impression type filter: Similar to how you can filter for "Discover" or "News," a filter showing queries where AI Overviews appeared
- Citation tracking: A "Featured in AI Overview" status similar to Featured Snippet reporting
- AI Overview CTR data: Separate click data for links clicked from within AI Overviews vs. traditional results
Medium probability (2027-2028):
- Source position reporting: Which position you held in the AI Overview source list
- AI Overview expansion tracking: Alerts when AI Overviews appear for new queries affecting your site
- Citation quality metrics: Quote prominence, context, sentiment
Lower probability but possible:
- AI Overview query volume: How many users saw the AI Overview vs. skipped past it
- AI Overview engagement: Did users expand/collapse, click sources, provide feedback?
- AI-specific keyword research: Suggested queries to target based on AI Overview opportunities
Preparing for Better Data
Why building your methodology now matters:
- Baseline comparison: When official metrics arrive, you'll have historical data showing pre/post trends
- Validation: You can verify your current methodology's accuracy against official data
- ROI proof: "We improved citation rate from 15% to 35% over 12 months" is powerful regardless of when official data arrives
- Process maturity: Your team will already have established workflows, dashboards, and decision frameworks
Action steps:
- Document your current methodology thoroughly (you're reading this guide—good start!)
- Maintain consistent tracking through 2026 regardless of official data timeline
- When Google announces new metrics, map them to your existing metrics for continuity
- Don't wait for official data to start optimizing—act on proxy metrics now
Industry Tool Evolution
Every major SEO platform is rapidly developing AI Overview tracking. Here's what to watch for when evaluating new tools.
Features to expect in 2026-2027:
- AI Overview appearance tracking: Daily monitoring of your keywords for AI Overview presence
- Citation frequency and positioning: Automated tracking of when and how you're cited
- Competitive analysis: Who else is being cited, how often, in what position
- Content recommendations: AI-powered suggestions for improving citation probability
- Impact forecasting: Predictive modeling of traffic impact based on AI Overview expansion
Questions to ask vendors:
- How frequently do you check for AI Overviews? (Daily minimum)
- What's your keyword limit for AI tracking? (Watch for restrictions)
- Do you track citation position or just yes/no presence?
- Can I see historical trends? How far back?
- Do you provide actionable optimization recommendations?
- What's your accuracy rate? (Ask for validation studies)
Red flags:
- Tools claiming 100% accuracy (AI Overview appearance is dynamic)
- No sample limitations (unlimited tracking claims are suspect)
- Lack of transparent methodology (how are they detecting AI Overviews?)
- No integration with other SEO metrics (AI visibility in isolation isn't useful)
Recommendation: Trial multiple tools when features launch, compare their data against your manual checks, select the one most aligned with your findings.
Conclusion: Measurement Enables Optimization
You can't improve what you don't measure. While Google Search Console doesn't yet provide direct AI Overview visibility reporting, the methodology outlined in this guide gives you actionable insights today.
The core approach: triangulation through multiple signals
- Query pattern analysis identifies likely AI-affected queries
- CTR pattern analysis quantifies the impact on your traffic
- Device and geographic segmentation validates your assumptions
- Manual spot-checking provides qualitative confirmation
- Tracking over time reveals optimization effectiveness
Starting simple and scaling up: You don't need to implement everything at once. Start with:
- Identifying your AI-likely queries and calculating exposure percentage (1-2 hours)
- Setting up weekly CTR tracking for those queries (30 minutes/week)
- Monthly manual checks of 20-30 key queries (1 hour/month)
That baseline gives you 80% of the value. Add complexity—device segmentation, advanced dashboards, third-party tools—as your needs and resources grow.
The goal: understand, track, optimize, repeat This isn't a one-time analysis. AI Overviews are expanding to new query types, evolving their citation algorithms, and changing user behavior. Regular monitoring allows you to:
- Spot emerging threats before they significantly impact traffic
- Validate that optimization efforts are working
- Identify new opportunities (queries where you could gain citations)
- Make data-driven decisions about resource allocation
Taking action: Measurement without optimization is pointless. Use your tracking data to:
- Prioritize content optimization based on impact and opportunity
- Justify resources for E-E-A-T improvement initiatives
- Guide content strategy toward less AI-vulnerable topics
- Build the business case for brand-building and diversification
Ready to start tracking? Download our free AI Overview Tracking Dashboard template and implement the methodology today. In 30 days, you'll have your first month of trend data. In 90 days, you'll have clear insights into your AI exposure and optimization opportunities. In 6 months, you'll be ahead of 90% of sites still wondering why their traffic declined.
[Download Free Tracking Dashboard Template]
Key Takeaways
-
GSC doesn't directly report AI Overview visibility—yet. Use indirect measurement through query pattern analysis and CTR depression to track impact.
-
Focus on "AI-likely" queries: Queries containing "how to," "what is," "best," "vs," and similar informational patterns are most likely to trigger AI Overviews.
-
Monitor CTR for position 1-3 queries. CTR depression (below 20% for position 1-3) strongly indicates AI Overview presence and impact.
-
Manual spot checks provide validation. Check 20-30 high-signal queries monthly to verify AI Overview presence and track your citation rate.
-
Third-party tools offer automation but aren't required. Start with free GSC methodology; upgrade to paid tools when you're tracking 200+ keywords and have budget.
-
Build a simple tracking dashboard. Monitor key metrics weekly, perform deep analysis monthly, and review quarterly for strategic adjustments.
-
Weekly spot checks + monthly deep analysis = optimal cadence. Consistent tracking matters more than perfect precision.
-
Use data to prioritize content optimization. Focus on high-traffic queries with low citation rates first for maximum impact.
-
Typical lag time: 4-8 weeks to see optimization results. Be patient—changes in citation rates take time as Google recrawls and reassesses.
-
Your baseline data will be valuable when Google adds official reporting. Start tracking now to have historical comparisons when native metrics launch.
Related Resources
- Parent Pillar: Adapting to AI Search - How Google's AI Overviews Change SEO - Comprehensive guide to understanding and optimizing for AI Overviews
- Cluster Post: AI Overviews Impact on Traffic - What the Data Shows - Industry-by-industry analysis of AI Overview traffic impact
- GSC Performance Report Guide - Master the fundamentals of Google Search Console reporting
- GSC Filters and Comparisons Tutorial - Advanced GSC filtering techniques
- Understanding GSC's Data Sampling and Limitations - Know what GSC data tells you (and what it doesn't)
- Setting SEO Goals Based on Current Performance - Establish baselines and realistic targets
About This Guide
This guide was last updated on January 21, 2026. AI Overview tracking methodologies and tools are evolving rapidly. We'll update this guide quarterly to reflect new developments, tools, and best practices.
Have questions or want to share your AI Overview tracking findings? Contact us or join the discussion in the comments below.
Schema Markup for this page:
{
  "@context": "https://schema.org",
  "@type": "HowTo",
  "name": "How to Track AI Overview Visibility Using Google Search Console",
  "description": "Step-by-step methodology for measuring Google AI Overview visibility using Google Search Console data, CTR analysis, and manual verification.",
  "totalTime": "PT2H",
  "tool": [
    {
      "@type": "HowToTool",
      "name": "Google Search Console"
    },
    {
      "@type": "HowToTool",
      "name": "Google Sheets"
    }
  ],
  "step": [
    {
      "@type": "HowToStep",
      "name": "Identify AI-Likely Queries",
      "text": "Use query pattern analysis to identify which queries are likely triggering AI Overviews",
      "url": "#step-1-identify-queries-likely-showing-ai-overviews"
    },
    {
      "@type": "HowToStep",
      "name": "Analyze CTR Patterns",
      "text": "Monitor click-through rates for high-ranking queries to detect AI Overview impact",
      "url": "#step-2-analyze-ctr-patterns-for-ai-impact"
    },
    {
      "@type": "HowToStep",
      "name": "Segment by Device and Geography",
      "text": "Compare mobile vs desktop and geographic performance to validate AI impact",
      "url": "#step-3-device-and-geographic-segmentation"
    },
    {
      "@type": "HowToStep",
      "name": "Perform Manual Verification",
      "text": "Spot-check actual search results to validate findings and track citation rates",
      "url": "#step-4-competitive-benchmarking-and-manual-verification"
    },
    {
      "@type": "HowToStep",
      "name": "Create Tracking Dashboard",
      "text": "Build a Google Sheets dashboard to monitor AI Overview visibility over time",
      "url": "#creating-your-ai-overview-tracking-dashboard"
    }
  ]
}