How to Read the GSC Performance Report
Learn how to read your GSC Performance Report. Understand clicks, impressions, CTR, and position with this beginner-friendly guide. Includes real examples and actionable tips.

How to Read Google Search Console Performance Report (Beginner Guide)
You have Google Search Console data. Now what? Here's how to read it.
The Performance Report shows how people find and click on your site in Google Search. This guide breaks down clicks, impressions, CTR, and position in plain English, plus what actions to take based on your data.
The Performance Report is your roadmap: where traffic comes from, which pages perform best, and where opportunities lie.
Accessing the Performance Report
Click "Performance" in the left sidebar (first item under the property selector).
The report shows the last 3 months by default: a line chart at the top showing trends, and a detailed table below showing queries, pages, or segments.
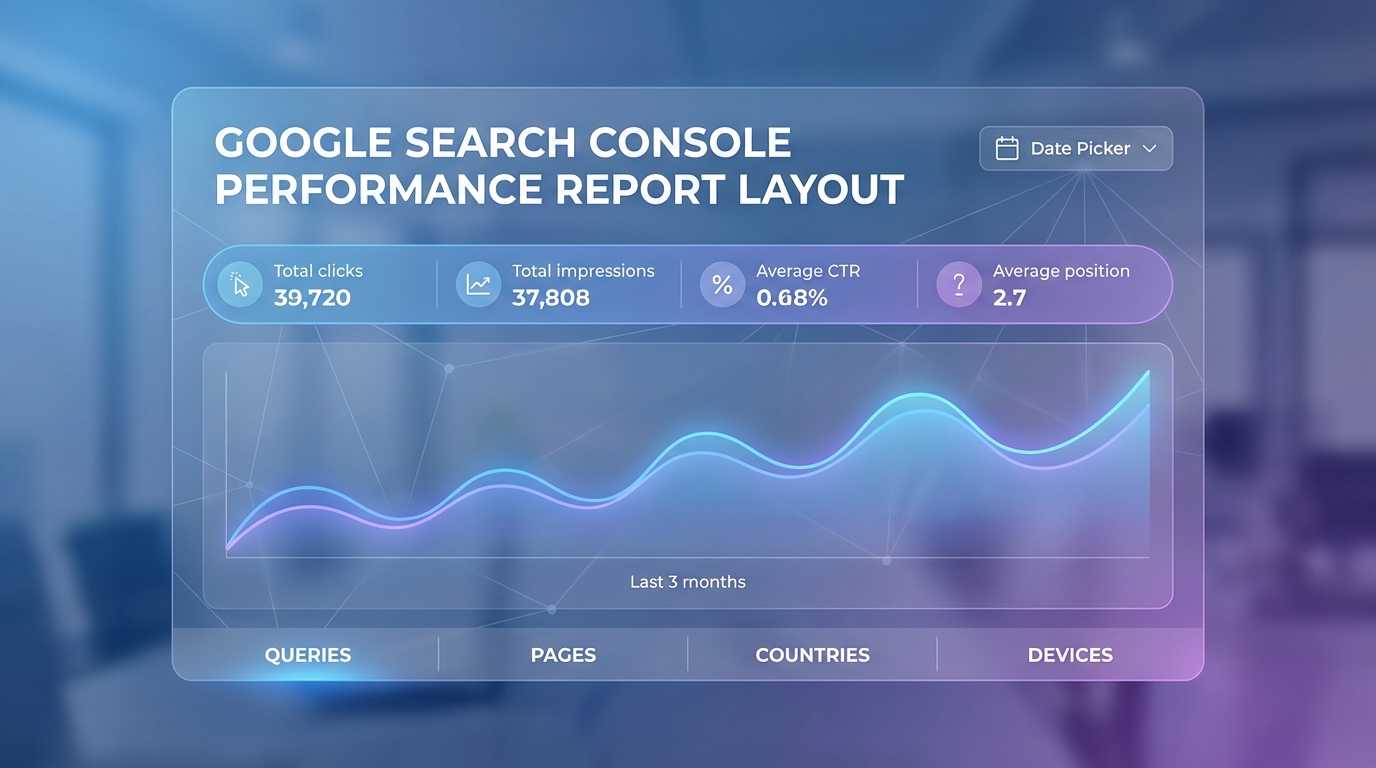
What You See First
Four large numbers display your totals:
- Total Clicks: Times people clicked to your site from Google
- Total Impressions: Times your site appeared in search results
- Average CTR: Percentage of impressions that resulted in clicks
- Average Position: Average ranking position across all impressions
Below totals: line chart showing metrics over time. Toggle metrics on/off by clicking buttons.
Five tabs segment your data:
- Queries: Search terms people used
- Pages: URLs that received traffic
- Countries: Geographic breakdown
- Devices: Mobile, desktop, tablet split
- Search Appearance: Rich result types
Top right: date picker to change time period and compare date ranges.
December 2025 Update: Weekly and Monthly Views
On December 10, 2025, Google announced a new granularity selector in the Performance Report. You can now view data aggregated by:
- Daily (Default): Traditional day-by-day breakdown
- Weekly: Data grouped by calendar week (Sunday-Saturday)
- Monthly: Data consolidated by calendar month
This helps smooth out daily noise and identify longer-term trends. Weekly views label each period by its ending Saturday. Access this by clicking the new granularity dropdown in the date picker area.
Understanding the Four Core Metrics
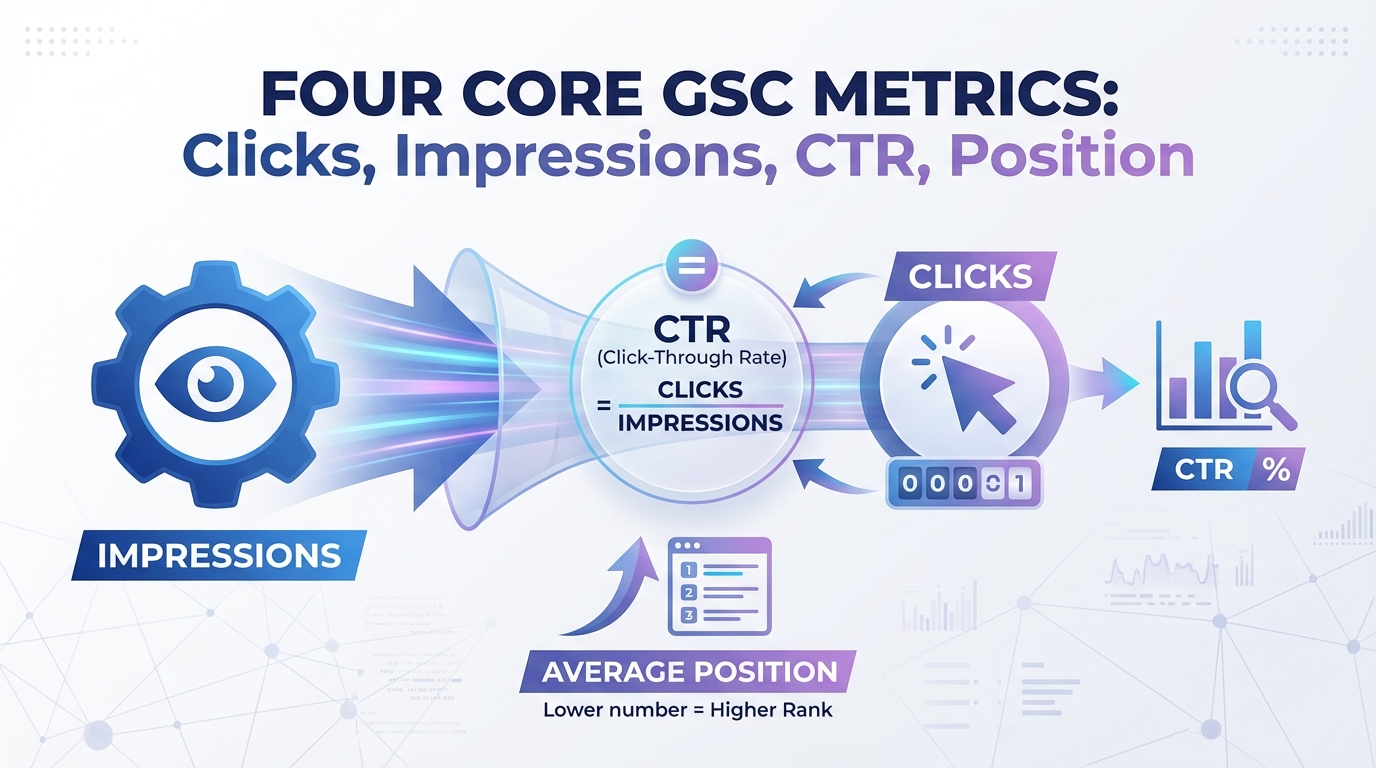
Metric #1: Clicks
Number of times users clicked on your site in Google search results.
What counts:
- User sees your site and clicks → Yes
- Clicks on paid ads → No (not tracked in GSC)
- User clicks then hits back button → Yes (click already happened)
What doesn't count: Impressions without clicks, "People Also Ask" boxes, Google Business Profile clicks
Clicks represent actual traffic—your bottom-line metric. Every click is a potential customer, reader, or conversion.
Benchmarks by site type:
- New blog: 10-100 clicks/day
- Established blog: 100-1,000 clicks/day
- E-commerce site: 500-5,000+ clicks/day
- Local business: 50-200 clicks/day
Focus on month-over-month growth, not arbitrary benchmarks.
Metric #2: Impressions
Times your site appeared in search results, clicked or not.
What counts:
- Result appeared on screen and user scrolled to see it → Yes
- Result on page 2+ but user didn't navigate there → No
- Result at bottom of page 1 but user didn't scroll → No (usually)
Google only counts impressions when your result was actually visible. Position #15 result without user scrolling past #10 = no impression.
Why it matters:
- Shows visibility—how often you appear
- High impressions + low clicks = CTR improvement opportunity
- Low impressions = need better rankings or more content
Impressions-to-Clicks relationship:
More impressions than clicks is normal. Typical CTR: 2-5% for most sites (1,000 impressions = 20-50 clicks).
Ratio changes by position:
- Position #1: 30-40% CTR (300-400 clicks per 1,000 impressions)
- Position #10: 2-3% CTR (20-30 clicks per 1,000 impressions)
Impressions show opportunity. Clicks show conversion of that opportunity.
Metric #3: CTR (Click-Through Rate)
Percentage of impressions that resulted in clicks.
Formula: (Clicks ÷ Impressions) × 100
Example: 100 clicks and 5,000 impressions = 2% CTR
CTR shows how compelling your search results are. Influenced by ranking position (higher = higher CTR) and title/meta quality (more compelling = more clicks).
CTR benchmarks by position (2026 data):
| Position | Average CTR |
|---|---|
| #1 | 39.8% |
| #2 | 18.7% |
| #3 | 10.2% |
| #4 | 7.2% |
| #5 | 5.1% |
| #6 | 4.4% |
| #7 | 3.0% |
| #8 | 2.1% |
| #9 | 1.9% |
| #10 | 1.6% |
Source: First Page Sage meta-analysis, 2026
Note on AI Overviews: For queries where Google shows AI Overviews, CTR dropped to 6.34% in September 2025 (down from 19.70% in June 2024). If your CTR suddenly declines, check whether AI Overviews now appear for your target queries.
CTR red flags:
- Positions 1-3 but CTR below 15% → Optimize title/meta
- Positions 5-10 but CTR above 15% → Great titles, improve rankings
- Overall CTR below 2% → Widespread title/meta issues or low rankings
Use CTR to identify opportunities. High impressions + decent position + low CTR = prime title tag optimization candidate.
Metric #4: Average Position
What it measures: Your average ranking position across all queries where you received impressions.
How it's calculated: This is a weighted average across all impressions.
Example calculation:
- You got 100 impressions at position #3
- You got 50 impressions at position #8
- Calculation: (3 × 100 + 8 × 50) ÷ 150 = (300 + 400) ÷ 150 = 4.67 average position
IMPORTANT: Average position is the most misunderstood metric in Google Search Console.
Here's what most beginners get wrong:
- You might never actually rank at your "average position"
- It's an average across hundreds or thousands of different queries
- It's also averaged across many different days
- It fluctuates constantly—daily changes are completely normal
If your average position is 4.3, that doesn't mean you consistently rank in position #4. It means that across all your queries and all the days in your selected time period, the weighted average works out to 4.3. Some queries might rank #1, others might rank #12, and everything in between.
Why it (sort of) matters:
Average position is useful for spotting trends, but not useful for making absolute statements:
- Good use: "Our average position improved from 8.2 to 6.4 over the past quarter" (shows positive trend)
- Bad use: "We rank in position #4 for our keywords" (not accurate—you rank at many different positions)
How to use average position correctly:
- Track the trend over time (is your average position improving or declining?)
- Compare segments (does your average position differ between branded vs non-branded queries?)
- Don't obsess over small changes (going from 4.3 to 4.5 is noise, not a real decline)
What's a good average position?
- Positions 1-10: Great—you're on page 1 on average
- Positions 10-20: Decent—you're hovering between pages 1 and 2
- Position 20+: Needs improvement—most traffic comes from page 1
SERP feature quirks: Position doesn't always match visual placement. Knowledge Panels are counted after the last organic result despite appearing above-fold. Google Ads don't factor into position calculations at all—if 4 ads appear, position #1 is still the first organic result.
Remember, this is an average. You'll have some queries performing much better and some performing much worse. For actionable insights, dig into individual queries rather than relying on the overall average.
Reading the Performance Chart
Understanding the Line Chart
The line chart at the top of the Performance Report shows your metrics trending over time. By default, it displays the last 3 months, but you can adjust this using the date picker in the top right.
You can toggle which metrics display by clicking the buttons at the top of the chart. Clicking "Total clicks" turns that line on or off, and you can do this for all four metrics. For easier reading, try showing just one or two metrics at a time—displaying all four can make the chart cluttered and hard to interpret.
Hover your mouse over any point on the chart to see the exact values for that specific date. This is useful for investigating specific spikes or drops.
What to Look For in the Chart
Instead of focusing on daily fluctuations, look for patterns. Here are the six most common patterns and what they mean:
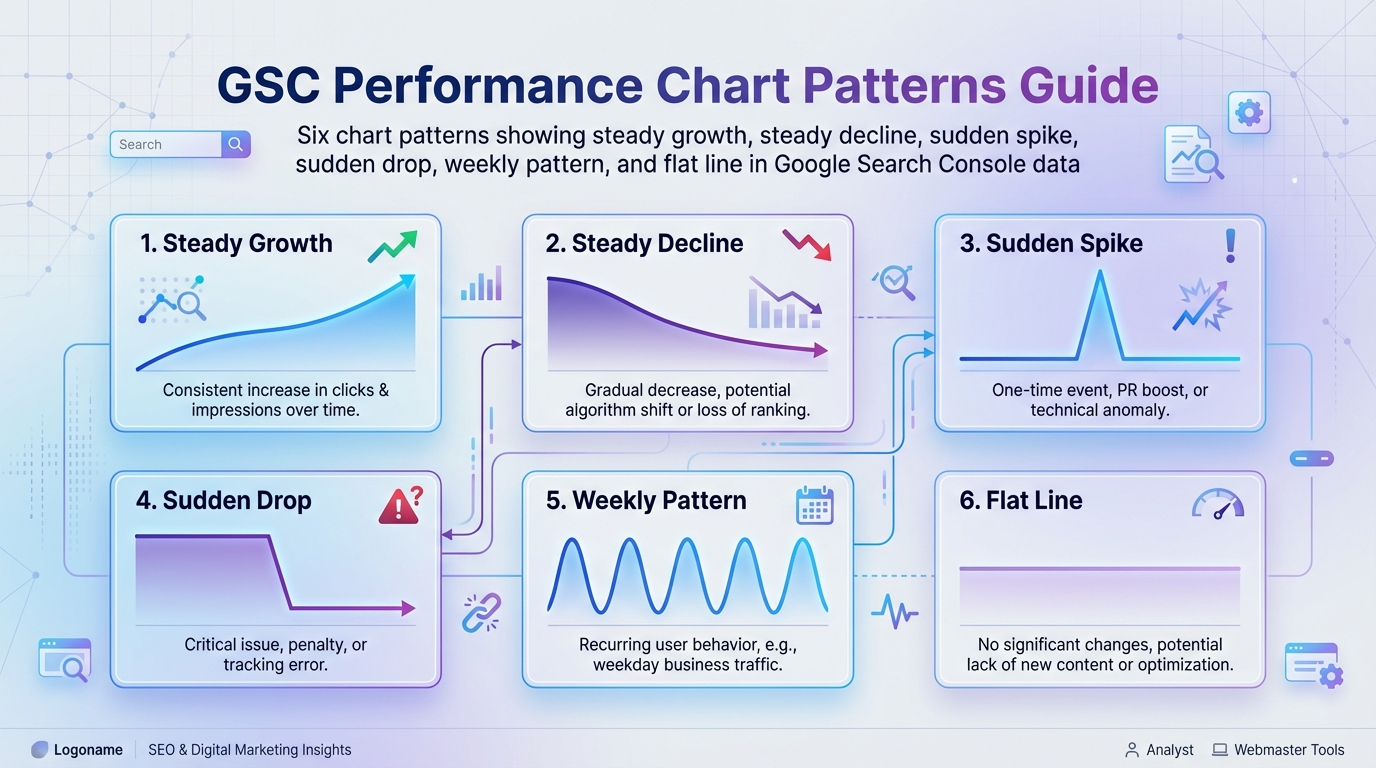
Pattern #1: Steady Growth
- The line trends upward consistently over weeks or months
- Meaning: Your SEO efforts are working
- Action: Keep doing what you're doing—you're on the right track
Pattern #2: Steady Decline
- The line trends downward consistently
- Meaning: There's a problem—could be technical issues, lost rankings, algorithm update impact, or seasonal changes
- Action: Investigate the cause immediately (check for technical errors, ranking changes, or algorithm updates)
Pattern #3: Sudden Spike
- Sharp increase on a specific date or over a few days
- Meaning: One of your pages went viral, you ranked for a new high-volume query, or there's a seasonal spike
- Action: Investigate what caused it—can you replicate this success?
Pattern #4: Sudden Drop
- Sharp decrease on a specific date
- Meaning: Lost rankings for important queries, technical issue preventing Google from accessing your site, algorithm update penalty, or seasonal drop
- Action: Requires immediate investigation—use the URL Inspection Tool and check your top queries
Pattern #5: Weekly Pattern
- Regular ups and downs that repeat every seven days
- Meaning: Normal user behavior—people search differently on weekdays vs weekends
- Action: None needed—this is completely expected and normal
Pattern #6: Flat Line
- No significant growth or decline over time
- Meaning: Traffic has plateaued
- Action: You need a catalyst—create new content, optimize existing pages, or pursue link building
Chart Best Practices
Toggle metrics strategically: Instead of showing all four metrics at once, toggle to display just 1-2 at a time. This makes trends much easier to spot.
Use the date picker to zoom in: If you see a spike or drop, adjust the date range to focus on that specific period. This helps you understand the pattern more clearly.
Compare date ranges: Don't analyze a single time period in isolation. Use the "Compare" feature in the date picker to compare this month vs last month, or this year vs last year. Context is everything.
Interpreting Metric Relationships
When analyzing your chart, look at how metrics move together:
| Pattern | What It Means | Action |
|---|---|---|
| High impressions, low clicks | Your results appear but don't entice clicks | Improve title tags and meta descriptions |
| Growing clicks, decreasing impressions | Positive signal—shedding irrelevant queries | Continue current strategy; you're attracting more qualified traffic |
| Growing impressions, flat clicks | Ranking for more queries but not converting visibility | Review which new queries you're appearing for; optimize CTR |
| All metrics declining together | Likely ranking drops or algorithm impact | Investigate specific queries and pages for root cause |
Data Limits to Know
- 16-month retention: GSC stores data for the last 16 months only. Export and archive data externally for longer analysis.
- 1,000-row export limit: The table shows up to 1,000 rows. Use filters to segment data if you need more granularity.
- 2-3 day lag: Most recent data is from 2-3 days ago. Dotted lines indicate preliminary data still being collected.
Using the Tabs: Queries, Pages, Countries, Devices, Search Appearance
Below the chart are five tabs that let you segment your data. Each tab gives you a different lens for understanding your search performance.
Queries Tab (Default)
This is your keyword goldmine. The Queries tab shows you the actual search terms people typed into Google before they found your site.
By default, queries are sorted by clicks (highest to lowest), but you can click any column header to sort differently. Each query shows all four metrics—clicks, impressions, CTR, and position.
What to look for:
- Your top keywords: Sort by clicks to see which search terms drive the most traffic
- High impression opportunities: Sort by impressions to find queries where you're visible but not getting enough clicks
- Brand vs non-brand split: Identify which queries include your brand name vs generic terms
- Unexpected queries: Sometimes you'll discover you rank for terms you didn't even know about—these can reveal new content opportunities
Quick action: Find one query with high impressions (1,000+), ranking in positions 5-10, and CTR below 5%. This is a prime optimization target—improve your ranking or CTR for this query and you'll gain significant traffic.
Advanced filtering: GSC supports regex patterns using Re2 syntax. Filter queries containing specific terms with patterns like .*keyword.* or match multiple terms with (term1|term2|term3). Click the filter dropdown and select "Custom (regex)" to enable.
Pages Tab
The Pages tab shows which URLs on your site receive search traffic. This is your content performance report.
What to look for:
- Top landing pages: Sort by clicks to see your most valuable pages
- Underperforming pages: Look for pages with high impressions but low clicks—these need title/meta optimization
- Declining pages: Click on individual pages to see their trend over time
- Unexpected pages: Sometimes pages you didn't expect rank well—understand why so you can replicate that success
Quick action: Identify your top 10 landing pages and bookmark them. These are your most valuable pages—protect them, monitor them closely, and keep them updated.
Countries Tab
This tab shows where your visitors are searching from geographically. For most sites, traffic will be concentrated in one or a few countries.
What to look for:
- Primary countries: Where does most of your traffic come from?
- Unexpected international traffic: Significant traffic from countries you didn't target might reveal opportunities
- Verification of targeting: Make sure traffic aligns with your target geography
Quick action: If you see significant traffic from non-target countries, consider whether there's an international SEO opportunity you're missing.
Devices Tab
This shows the breakdown between mobile, desktop, and tablet users. In today's mobile-first world, most sites see 60-80% mobile traffic.
What to look for:
- Mobile vs desktop traffic split: Is it in line with industry norms (usually mobile-heavy)?
- Device-specific CTR differences: If mobile CTR is significantly lower than desktop, it might indicate mobile UX issues
- Device-specific position differences: Sometimes mobile and desktop rankings differ
Quick action: If your mobile CTR is significantly lower than desktop CTR (at similar positions), investigate your mobile user experience. Your mobile snippet might not be displaying correctly, or users might be having trouble clicking on your result.
Search Appearance Tab
This tab only appears if your site has rich results—special result types like FAQ snippets, review stars, recipe cards, or other enhanced search features.
What to look for:
- CTR lift from rich results: Compare your CTR with rich results vs without
- Which pages have rich results: Identify which structured data is working
- Rich result errors: Sometimes structured data breaks—this tab will show issues
Quick action: If this tab is available, compare the CTR of results with rich results vs normal results. Rich results typically increase CTR significantly—this data can justify investing more time in structured data implementation.
Table View: Sorting and Finding Insights
How to Use the Table
Below the chart and tabs, you'll see a detailed table showing individual rows of data. By default, it shows 10 rows, but you can click "Load more" at the bottom to see up to 1,000 rows.
The real power of this table is in the sorting and filtering. Click any column header to sort by that metric.
Useful Sorting Techniques
Each sorting method reveals different insights:
Sort by Clicks: This is the default. It shows your top performers—the queries or pages driving the most actual traffic. Use this to identify your most valuable assets.
Sort by Impressions: This reveals visibility opportunities. Queries with high impressions but low clicks are perfect candidates for optimization. You're already visible—you just need to convert more of those impressions into clicks.
Sort by CTR: This shows your most compelling results. Pages or queries with high CTR (above 10-15%) indicate great titles and meta descriptions. Study these to understand what makes them effective, then apply those lessons to lower-CTR pages.
Sort by Position: This shows your best and worst rankings. Sort ascending to see your #1 rankings (protect these), or descending to see your worst rankings (decide whether to improve them or abandon them).
Clicking Into Rows
Here's a powerful feature many beginners miss: you can click on any row to drill down deeper.
- Click any query → See which specific pages rank for that query
- Click any page → See which queries drive traffic to that page
This connection between queries and pages is incredibly powerful. For example, if you see a high-impression query with low CTR, click it to find which page ranks for it, then optimize that specific page's title and meta description.
Common Beginner Mistakes
Avoid these seven mistakes that trip up most people when they first start using the Performance Report:
Mistake #1: Only Looking at Total Numbers
The big numbers at the top—total clicks, impressions, CTR, and position—are useful for a quick overview, but they don't tell you where to take action.
Don't stop at "we got 10,000 clicks this month." Dig into the Queries and Pages tabs to see which specific keywords and pages drove those clicks. That's where you find actionable insights.
Mistake #2: Comparing Different Metrics Without Context
"Our average position improved but clicks dropped" sounds contradictory, but it's not when you consider all metrics together.
Maybe your impressions dropped significantly—your position improved on the queries you do rank for, but you're appearing for fewer total queries. Or maybe you're ranking better for low-volume queries but worse for high-volume queries.
Always consider all four metrics together, not in isolation.
Mistake #3: Panicking Over Daily Fluctuations
Your clicks went from 350 yesterday to 305 today. Is that bad?
No—that's normal noise. Daily fluctuations of 5-15% are completely expected. User behavior varies day to day, Google constantly tests different search results, and rankings fluctuate naturally.
Look at weekly or monthly trends instead. Seven consecutive days of decline is a signal. One day drop is noise.
Mistake #4: Ignoring Impressions
Many beginners focus exclusively on clicks because they seem more "real." But impressions are equally important—they show opportunity.
A query with 10,000 impressions, position #7, and 2% CTR is a massive opportunity. Improve your ranking to position #3, and that CTR might jump to 15%, giving you 1,500 clicks instead of 200—without creating any new content.
Mistake #5: Not Using Date Comparisons
Analyzing a single time period in isolation doesn't give you context. Is 500 clicks per day good? That depends—is it up or down from last month?
Always use the date comparison feature. Compare this month vs last month, or this year vs last year. Trends matter more than absolute numbers, especially when you're just starting out.
Mistake #6: Expecting Real-Time Data
You published a new blog post this morning and check GSC in the afternoon expecting to see data. There's nothing there—is something wrong?
No—GSC data typically lags 2-3 days. The most recent data you see is usually from 2-3 days ago. Don't expect to see today's performance immediately.
Mistake #7: Treating Average Position as Absolute
"We rank #4" sounds definitive, but if your average position is 4.3, you don't actually rank in position #4 consistently.
You might rank #1 for some queries, #8 for others, and everything in between. Average position is useful for tracking trends ("our position improved from 8.2 to 6.4"), but not for making absolute claims about your rankings.
Your First Performance Report Checklist
Now that you understand how to read the Performance Report, here's a practical checklist for what to actually do with it.
What to Check Every Week
- Total clicks trend: Are clicks going up, down, or staying flat?
- Chart patterns: Are there any sudden spikes or drops that need investigation?
- Top 5 queries: Are they what you expect? Any surprises?
- Top 5 pages: Are your best content pieces still performing?
- Overall CTR: Is it improving or declining?
This weekly check takes about 10 minutes and keeps you connected to your search performance without overwhelming you with data.
What to Investigate Monthly
- Month-over-month comparison: Set up a date comparison to see how this month compares to last month
- New queries in top 100: Are you ranking for new terms?
- Pages with declining clicks: Identify any pages losing traffic and investigate why
- High impression, low CTR opportunities: Find 3-5 queries to optimize
- Device performance: Are there significant differences between mobile and desktop?
This monthly deep dive takes 30-60 minutes and helps you identify optimization opportunities and catch problems before they become serious.
What to Analyze Quarterly
- Year-over-year comparison: How does this quarter compare to the same quarter last year?
- Content performance patterns: Which types of content perform best?
- Seasonal trends: Identify recurring seasonal patterns in your traffic
- International traffic opportunities: Should you pursue other languages or countries?
This quarterly strategic review takes 1-2 hours and informs your bigger SEO strategy decisions.
Key Takeaways
Let's recap what you've learned about reading the GSC Performance Report:
The Four Metrics:
- Clicks = actual traffic (your most important metric)
- Impressions = visibility (shows opportunity)
- CTR = how compelling your search results are
- Position = average ranking (use for trends only, not absolute claims)
How to Use the Report:
- Use the five tabs to segment data (Queries, Pages, Countries, Devices, Search Appearance)
- Sort the table different ways to find different insights
- Look for trends over weeks and months, not daily fluctuations
- Always compare date ranges for context
- Start simple—identify your top queries and pages first
What to Avoid:
- Don't obsess over daily changes
- Don't analyze metrics in isolation
- Don't expect real-time data
- Don't treat average position as your actual ranking
The Performance Report isn't complicated once you understand what you're looking at. Start by spending just 10 minutes per week checking your top queries and pages. As you get more comfortable, you'll naturally start digging deeper into trends, patterns, and opportunities.
Next Steps: Putting Your Knowledge Into Action
You now know how to read the Performance Report—congratulations! Here's what to do next:
Immediate actions (do these now):
- Open your Performance Report and spend 10 minutes exploring
- Identify your top 10 queries (Queries tab, sorted by clicks)
- Identify your top 10 landing pages (Pages tab, sorted by clicks)
- Find one query with high impressions (1,000+) and position 5-10—this is your first optimization target
This week:
- Set up a weekly reminder to check your Performance Report
- Create a simple spreadsheet to track your top 5 queries and pages over time
- Compare this month to last month using the date comparison feature
Your Next Step: Establish Your SEO Baseline
You can now read your GSC data. But how do you know if your numbers are good or bad? You need context. That's where setting up your SEO baseline becomes critical.
→ Next: Setting Up Your SEO Baseline: What to Measure and Track
A baseline is your site's "normal" performance range. Without it, you can't distinguish real problems from everyday noise. Is a 15% traffic drop concerning or normal weekly fluctuation? You won't know without a baseline.
This guide shows you exactly which metrics to track, how to set alert thresholds, and how to detect genuine issues early. It takes 2-3 hours to set up initially, then 15 minutes per week to maintain—and it's the foundation for all future SEO diagnostics.
Go deeper:
Ready to explore specific reports and advanced analysis? Here are your next learning steps:
- Understanding the GSC Performance Report: What Your Data Is Really Telling You — Move from reading data to interpreting insights, pattern recognition, and understanding causation vs correlation
- GSC Queries Report: How to Find Your Biggest Opportunities — Master query analysis, discover untapped keyword opportunities, and prioritize optimization efforts
- Pages Report Analysis: Identifying Your Best and Worst Performers — Deep dive into page-level performance, identify declining pages, and understand what makes top pages successful
- How to Interpret GSC Click-Through Rate Data — Advanced CTR analysis, benchmark your performance, and learn specific optimization techniques
- Position Tracking in GSC: What Average Position Really Means — Understand the nuances of position tracking, when to trust it, and when to ignore it
Return to the complete guide: The Complete Guide to Google Search Console Analysis — Explore all aspects of GSC from setup to advanced troubleshooting.
Related Articles:
- Understanding the GSC Performance Report: What Your Data Is Really Telling You
- GSC Queries Report: How to Find Your Biggest Opportunities
- How to Interpret GSC Click-Through Rate Data
- How to Set Up Google Search Console: Complete 2026 Guide
Last updated: January 2026. Google Search Console interface and features may change over time.