GSC Data Interpretation: Reading Patterns
Learn how to interpret Google Search Console data beyond basic metrics. Discover signal vs noise patterns, causation analysis, and four-metric stories that reveal actionable SEO insights.

Understanding the GSC Performance Report: What Your Data Is Really Telling You
Your GSC data tells a story. Most people see numbers—learn to see the narrative.
SEO professionals check their Performance Report daily: "What does this mean?" Clicks up 12%, impressions down 8%, position improved by 0.3. What action should they take?
The difference between data and understanding: recognizing patterns, distinguishing signal from noise, and building cause-and-effect narratives.
This guide moves you from basic reporting ("clicks increased 15%") to deep analysis ("clicks increased 15% because we improved position from 8.2 to 6.1 on commercial keywords—title tag optimizations work, apply this strategy to similar pages").
New to Performance Report basics? Start with How to Read Google Search Console Performance Report. This assumes you understand the four core metrics and takes you to interpretation, pattern recognition, and extracting actionable insights.
The Difference Between Data and Insights
Reporting answers "what happened?":
- Clicks increased 15%
- Impressions dropped 8%
- Average position improved by 0.3
- CTR went from 3.2% to 3.8%
Analysis answers "why?" and "what should we do?":
- Clicks increased 15% because we improved position from 8.2 to 6.1 on commercial keywords. Title tag optimizations and content depth improvements work. Apply this strategy to other product category pages ranking positions 7-10.
Reporting summarizes numbers. Analysis builds narratives that connect cause to effect and point toward action.
The Questions Your Data Answers
When you look at your GSC Performance Report, you should be asking:
What's working? (Double down here)
- Which pages are growing traffic?
- Which queries are you climbing rankings for?
- Which content updates led to improvements?
- What optimization strategies are succeeding?
What's not working? (Fix or abandon)
- Which pages are losing traffic?
- Which queries are you dropping rankings for?
- Which content is decaying?
- What optimization attempts failed?
Where's the opportunity? (Prioritize this)
- Which queries have high impressions but position 5-10? (Quick wins)
- Which pages rank for unexpected queries? (Expansion opportunity)
- Which keywords are growing in search volume?
- Which competitors are you close to overtaking?
What's changing? (Monitor closely)
- Which trends are emerging in your data?
- Are there new query patterns appearing?
- Is search behavior shifting in your niche?
- Are there seasonal patterns developing?
Why did this happen? (Learn and replicate)
- Can you identify the cause of positive changes?
- What external factors affected your performance?
- Did your actions lead to the outcomes you see?
- What can you learn for future optimization?
Connecting Metrics to Meaning
Here's the critical insight most people miss: Every number tells part of the story, but metrics in isolation are meaningless.
Example: Your clicks dropped 20%.
Without context, this looks bad. But let's add context:
Scenario A (Bad):
- Clicks: Down 20%
- Impressions: Flat
- CTR: Down 20%
- Position: Flat
- Story: You have a CTR problem. Competitors may have added rich results, your titles may be stale, or SERP features are taking clicks.
Scenario B (Not as bad as it looks):
- Clicks: Down 20%
- Impressions: Down 20%
- CTR: Flat
- Position: Flat
- Story: Search volume decreased (likely seasonal). Your rankings and CTR are stable. This is expected and not necessarily a problem.
Scenario C (Actually good news):
- Clicks: Down 20%
- Impressions: Down 40%
- CTR: Up 25%
- Position: Worse
- Story: You lost rankings (bad), but you're getting much more efficient with the visibility you have (good). Focus on improving position to capitalize on your improved CTR.
The same 20% drop in clicks tells three completely different stories depending on what's happening with the other metrics. Context is everything.
Reading Trends: Signal vs Noise
One of the most valuable skills in GSC data analysis is distinguishing meaningful changes (signal) from random fluctuations (noise).
What Is "Noise" in GSC Data?
Noise is variation that doesn't indicate a meaningful change in your site's performance. Common sources:
Daily fluctuations (5-15% normal)
- Search behavior varies by day
- Different query volumes on different days
- Google's ranking algorithm makes micro-adjustments
Day-of-week patterns
- Weekends often have lower traffic for B2B sites
- Weekdays may be lower for entertainment/hobby content
- Monday typically differs from Friday
Holiday impacts
- Expected drops during major holidays
- School breaks affect education content
- Shopping behavior changes around Black Friday, Christmas
Random ranking volatility
- Small position movements (±1-2 spots) happen constantly
- SERP reshuffling as Google tests
- Temporary ranking boosts or drops
Google testing SERPs
- Google constantly tests different SERP layouts
- Your position may fluctuate as they test
- Usually normalizes within days
What Is "Signal" in GSC Data?
Signal is variation that indicates a real change requiring attention:
Sustained trends (7+ days in same direction)
- Consistent upward or downward movement
- Pattern continues beyond normal fluctuations
- Not reversed by normal volatility
Significant changes (25%+ sustained)
- Large magnitude changes relative to your baseline
- Especially important for high-traffic pages/queries
- Not explained by known seasonal factors
Correlated changes across metrics
- Multiple metrics moving together in logical ways
- Pattern tells a coherent story
- Changes align across pages or queries
Changes matching known events
- Traffic change coincides with your site update
- Drop aligns with known algorithm update
- Pattern matches published Google changes
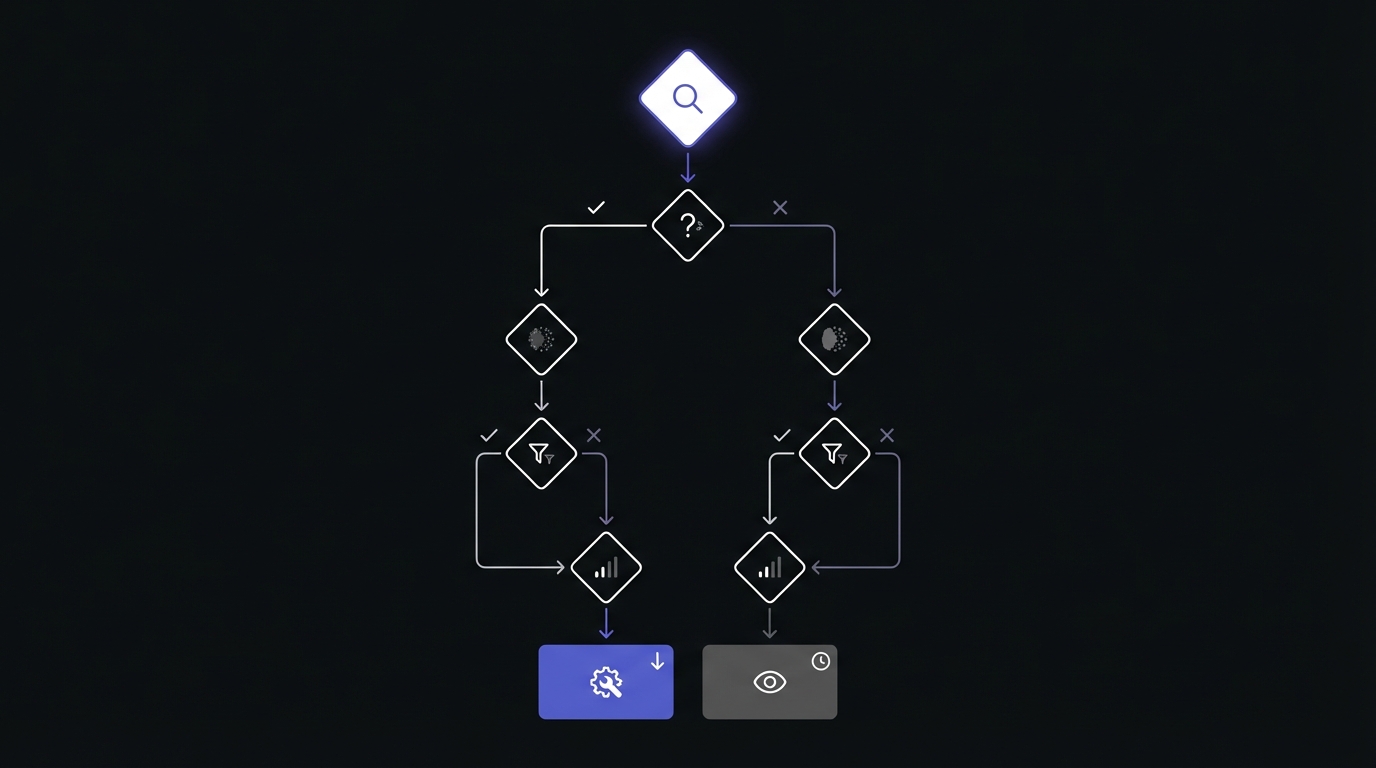
How to Distinguish Signal from Noise
Technique #1: The 7-Day Rule
Don't react to single-day changes or even 2-3 day patterns. Use this rule:
- Day 1-2: Note the change, but don't act
- Day 3-4: Start monitoring more closely
- Day 5-6: If the pattern continues, investigate causes
- Day 7+: If sustained, this is likely signal—take action
Exception: Sudden dramatic drops (50%+) warrant immediate investigation even on day 1.
For smoothing out noise, use 28-day moving averages instead of daily data. This removes daily volatility and reveals the underlying trend.
Technique #2: Magnitude Matters
Not all changes are equal. Use these magnitude guidelines:
- 0-10% change: Usually noise, don't act unless sustained 14+ days
- 10-25% change: Possible signal, monitor for 7 days
- 25-50% change: Likely signal, investigate after 3-5 days
- 50%+ change: Definitely signal, investigate immediately
But beware of small absolute numbers: A 50% change on 10 clicks per day is only 5 clicks. A 10% change on 10,000 clicks per day is 1,000 clicks. Focus magnitude assessment on high-volume pages and queries.
Technique #3: Multiple Metric Correlation
Look at how metrics move together:
Clicks down + Impressions flat = CTR problem (signal)
- You're getting the same visibility but fewer clicks
- Indicates title/description problem or competitor improvements
- Clear signal to investigate CTR optimization
Clicks down + Impressions down = Ranking/visibility problem (signal)
- You're losing both visibility and clicks proportionally
- Indicates ranking drops or index issues
- Clear signal to investigate ranking factors
Clicks down but everything else normal = Probably noise
- If impressions, CTR, and position are stable but clicks drop
- Often just random variation in click-through behavior
- Monitor but probably not actionable
All metrics moving in same direction = Strong signal
- Everything up or everything down
- Indicates a systemic change
- Highest priority to understand cause
Technique #4: Year-Over-Year Comparison
This removes seasonal noise and reveals true growth:
Current period: 10,000 clicks
Same period last year: 8,000 clicks
YoY growth: +25%
Even if your month-to-month data is noisy, YoY comparison cuts through:
- Seasonal patterns repeat yearly
- Reveals actual growth or decline
- Accounts for market maturity
Important: When using YoY, account for known changes like major content additions, site redesigns, or significant algorithm updates that make direct comparison less meaningful.
Seasonal Patterns: Expected vs Unexpected Changes
One person's catastrophe is another person's normal seasonal pattern.
Identifying Your Seasonal Patterns
Most websites have seasonal traffic patterns:
Calendar-based seasonality:
- E-commerce sites spike in Q4 (holiday shopping)
- Tax-related content peaks January-April
- Fitness content spikes in January (New Year's resolutions)
- Travel content peaks in summer months
School-year patterns:
- Education content drops in summer
- Back-to-school content spikes in August/September
- College-related searches peak during application seasons
Industry cycles:
- B2B SaaS often sees December/January slowdown
- Real estate activity varies by season and region
- Wedding content peaks in spring and summer
- Sports content follows seasonal schedules
Weather patterns:
- Heating/cooling content by season
- Outdoor activity content peaks with good weather
- Seasonal product searches (ski equipment, swimming pools)
How to Establish Your Seasonal Baseline
Follow these steps to understand your normal patterns:
Step 1: Export 12-24 months of GSC data (the more history, the better)
Step 2: Create a monthly summary:
Month       | Total Clicks | YoY Change
------------|--------------|------------
Jan 2025    | 45,000       | +12%
Dec 2024    | 38,000       | -15%
Nov 2024    | 52,000       | +8%
...
Step 3: Plot monthly totals on a line chart to visualize patterns
Step 4: Identify recurring patterns:
- Which months are consistently high?
- Which months consistently dip?
- Are patterns consistent year-over-year?
Step 5: Document your seasonal baseline:
- "Normal for us to drop 20% in December"
- "Always spike 40% in September"
- "Summer months typically 15% below winter"
Step 6: Use this baseline for all future analysis
Seasonal Changes Are Not Problems
Once you establish your baseline, recognize that seasonal changes are expected:
B2B SaaS example:
- December drops 25% = Normal (business slows for holidays)
- January drops another 10% = Normal (slow start to year)
- February recovers 35% = Normal (business returns)
- Action: None required, this is expected behavior
Fitness site example:
- January spikes 60% = Normal (New Year's resolutions)
- February holds 50% above baseline = Normal (resolutions continue)
- March drops 40% = Normal (resolutions fade)
- Action: Prepare content calendar around these patterns, but don't panic at March drop
Education content example:
- Summer drops 35% = Normal (school is out)
- August recovers 20% = Normal (back to school preparation)
- September peaks = Normal (school year starts)
- Action: Plan maintenance and new content creation for summer when traffic is low
When Seasonal Doesn't Explain It
Sometimes the pattern breaks, indicating a real problem:
Red flag #1: Change magnitude exceeds historical pattern
- Normal December drop: 20%
- This December: 45%
- Action: Investigate—something beyond seasonality is happening
Red flag #2: Pattern breaks (drop during high season)
- September normally spikes 40%
- This September: Flat or down
- Action: Something prevented the normal seasonal increase
Red flag #3: YoY comparison shows decline even accounting for season
- Last January: 45,000 clicks
- This January: 38,000 clicks (-15%)
- Action: You're underperforming compared to same season last year
When seasonal patterns don't explain the change, you have a real issue that requires investigation.
GSC data limitation: GSC retains only 16 months of historical data. Export data monthly to build long-term baselines for seasonal analysis spanning multiple years.
Correlation vs Causation: What Actually Caused the Change
The most common mistake in GSC data analysis: assuming that because two things happened at the same time, one caused the other.
The Correlation Trap
Example of correlation without causation:
You published 10 new blog posts on January 15th. On January 20th, your traffic increased 18%. Did the new content cause the increase?
Not necessarily. During the same period:
- Your main competitor's site went down for 2 days
- There was a Google algorithm update
- It's the third week of January (post-holiday recovery)
- You also fixed a mobile usability issue
- Your seasonal pattern shows January always increases
Any of these could be the actual cause. The timing correlation isn't enough to establish causation.
Building a Cause-and-Effect Narrative
Use this three-step process to build evidence-based causation narratives:
Step 1: Identify the change
- What changed? Clicks increased 18%
- When did it change? Started January 20th
- Magnitude? +18% sustained for 10 days
- Which pages/queries? Need to drill down
Step 2: What else changed around that time?
Your site changes:
- Published 10 new blog posts (Jan 15)
- Fixed mobile usability issue (Jan 12)
- Updated 5 existing posts (Jan 10)
- Added FAQ schema to product pages (Jan 8)
External factors:
- Google confirmed minor algorithm update (Jan 18)
- Main competitor site downtime (Jan 18-19)
- Post-holiday traffic recovery (normal pattern)
- Industry news event drove searches (Jan 17)
Step 3: Look for supporting evidence
Evidence supporting new content as cause:
- Are the 10 new blog posts receiving traffic? (Check Pages report)
- Did traffic increase specifically for queries those posts target?
- Is the timing aligned? (New posts often take 3-7 days to gain traction)
Evidence supporting mobile usability fix:
- Did mobile traffic specifically increase more than desktop?
- Did mobile CTR improve?
- Were there mobile usability errors before the fix?
Evidence supporting algorithm update:
- Did competitors see similar changes?
- Is the change site-wide or specific to certain query types?
- Does the pattern match reported algorithm update impacts?
Common Causation Scenarios
Scenario #1: Content Refresh Worked
Pattern:
- Updated article on March 5th
- Starting March 8th (3 days later):
- That specific page's impressions increased 45%
- That specific page's clicks increased 38%
- Queries for that page improved from position 7.2 to 4.8
- Other pages remained stable
Verdict: Likely causation. The timing, specificity, and logical connection strongly suggest the content update caused the improvement.
Scenario #2: Algorithm Update Impact
Pattern:
- Traffic dropped 22% starting April 12th
- Google confirmed algorithm update April 11-15
- Decline is broad (30+ pages affected)
- Pattern matches reported update characteristics (affecting thin content)
- Competitors in your niche saw similar drops
Verdict: Likely causation. The timing, breadth, and alignment with reported update characteristics indicate algorithm impact.
Scenario #3: Seasonal + Algorithm (Confounded)
Pattern:
- Traffic dropped 35% in December
- Google also released an algorithm update December 10th
- Your industry always drops in December (typically 20%)
- Competitors saw mixed results (some down, some flat)
Verdict: Mixed causes requiring deeper analysis:
- ~20% likely due to normal seasonal pattern
- ~15% potentially due to algorithm update
- Need to compare to previous Decembers to isolate algorithm impact
Scenario #4: False Causation (Correlation Only)
Pattern:
- You changed homepage banner image May 5th
- Traffic increased 12% starting May 6th
- Investigation shows:
- Homepage traffic unchanged
- Increase came from blog posts
- Blog posts ranking for queries related to trending news event
- Trending topic appeared in news May 4th
Verdict: Correlation without causation. The banner change timing was coincidental. The real cause was external trending topic driving searches for content you already rank for.
The "What If" Test
Ask these questions to test causation:
If you hadn't made the change, would the outcome be different?
- Look at pages you didn't change—did they show the same pattern?
- If yes, probably not your change
- If no, stronger evidence for causation
Did competitors see the same pattern?
- If competitors also dropped/gained traffic, probably external factor
- If only you changed, probably something you did (good or bad)
Is the pattern specific or broad?
- Change affects only pages you modified = likely your change
- Change affects entire site including unchanged pages = probably external
Does the timing make sense?
- Content updates typically show impact 3-7 days later
- Technical fixes can show impact within 1-3 days
- New content takes longer (1-4 weeks) to gain traction
- If timing doesn't align with reasonable expectations, look for other causes
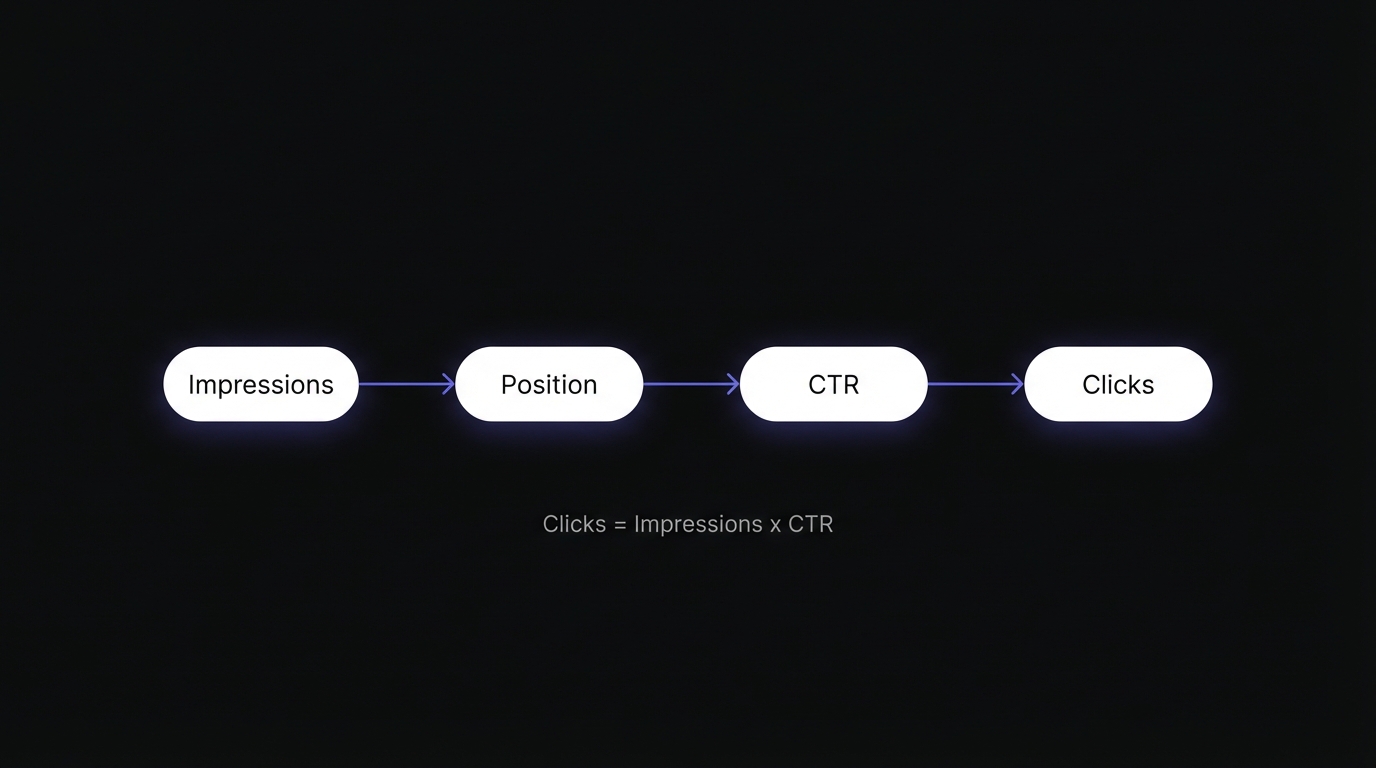
Reading the Four-Metric Story
The four core metrics—impressions, position, CTR, and clicks—don't exist in isolation. They tell an interconnected story, and reading that story correctly is the key to proper GSC analysis.
The Four Metrics Tell Different Parts of the Story
Impressions = Visibility story
- How often your site appears in search results
- Reflects rankings, query volume, and SERP features
- Leading indicator (changes first)
Position = Rankings story
- Where you rank on average across queries
- Affects both impressions and CTR
- Direct ranking factor indicator
CTR = Compelling title/description story
- How often impressions convert to clicks
- Reflects title quality, meta description, rich results, competition
- Efficiency metric
Clicks = Bottom-line results story
- Actual traffic you're receiving
- Outcome of the other three metrics
- Lagging indicator (changes last)
The relationship: Clicks = Impressions × CTR (simplified, as position affects CTR)
Common Four-Metric Patterns and What They Mean
Pattern #1: Clicks ↑, Impressions ↑, CTR →, Position →
Story: More people are searching for what you rank for (seasonal or growing market). Your rankings and click efficiency are stable, but increased search volume is driving more traffic.
Action: Ride the wave. Consider expanding into related topics to capture more of this growing interest. This is a favorable situation requiring little immediate action.
Example: Your travel blog sees this pattern in April-May as summer vacation planning searches increase.
Pattern #2: Clicks ↑, Impressions →, CTR ↑, Position →
Story: You're attracting more clicks from the same visibility (better titles/descriptions or competitor changes). Your rankings are stable, but you're being more compelling in the SERPs.
Action: Analyze what titles and meta descriptions are working. Replicate this optimization approach on other pages. This indicates successful on-SERP optimization.
Example: You improved title tags to be more benefit-focused and specific, and users are clicking more.
Pattern #3: Clicks ↓, Impressions ↓, CTR →, Position ↓
Story: You lost rankings (technical issue, algorithm update, or content decay). Everything is dropping proportionally—you're less visible and getting correspondingly fewer clicks.
Action: Investigate ranking loss causes:
- Check for technical issues (indexation, speed, mobile usability)
- Review for algorithm update impacts
- Analyze if content has become outdated
- Check if competitors have improved
Example: An algorithm update penalized thin content, and you dropped from page 1 to page 2 for key queries.
Pattern #4: Clicks →, Impressions ↑, CTR ↓, Position ↓
Story: More impressions but lower positions equals ranking for more keywords but not highly. You're appearing in more searches (good) but in worse positions (bad), and the net result is stable clicks.
Action: Focus on improving position for high-volume queries. You're gaining visibility breadth but need ranking depth. Prioritize improving position on queries with highest impression volume.
Example: Your content refresh added more long-tail keywords (more impressions), but you're ranking positions 8-12 for them (lower CTR).
Pattern #5: Clicks ↓, Impressions →, CTR ↓, Position →
Story: Same visibility but fewer clicks equals CTR problem. You're maintaining rankings and impressions, but something changed in the SERPs to reduce your click-through rate.
Action: Investigate CTR optimization:
- Competitors may have added rich results
- Your titles may need refreshing
- SERP features (People Also Ask, Featured Snippets) may be capturing clicks
- Meta descriptions may not be compelling
Example: A competitor added star ratings rich results, making their listing more attractive than yours despite similar rankings.
Pattern #6: Clicks ↑, Impressions →, CTR →, Position ↑
Story: Rankings improved, maintaining CTR, getting more clicks. This is the ideal optimization outcome—you improved position while maintaining click efficiency.
Action: Optimal scenario. Identify what worked (content update? technical fix? backlinks?) and replicate on other pages. Document this success for your SEO playbook.
Example: Your comprehensive content update improved position from 6.5 to 3.2, and you're getting proportionally more impressions and clicks.
Pattern #7: Clicks →, Impressions →, CTR →, Position →
Story: Everything is flat (plateau or stable mature site). You've reached equilibrium with no growth or decline.
Action: You need new stimulus:
- Create new content targeting new keywords
- Expand into related topics
- Launch an optimization push on existing content
- Consider technical improvements
- Build more backlinks
Example: Your site has been stable for 6 months with no new content or optimization work. You've maximized current content and need expansion.
Using Filters to Understand the Story Better
Critical insight: Don't just look at site-wide patterns. Different parts of your site tell different stories.
Filter by page type:
- Blog posts might be growing (content strategy working)
- Product pages might be stable (mature category)
- Category pages might be declining (competition increasing)
Filter by query type:
- Brand queries should be stable (unless brand awareness campaigns)
- Commercial queries ("buy," "best," "review") show purchase intent
- Informational queries ("how to," "what is") show awareness stage
Filter by device:
- Mobile traffic growing faster than desktop (normal trend)
- Mobile CTR lower than desktop (title length or SERP crowding)
- Mobile position lower (mobile usability issues)
Example analysis using filters:
- Site-wide: Clicks flat
- Blog posts only: Clicks up 25%
- Product pages only: Clicks down 15%
Story: Your content strategy is working (blog growing), but you have a product page problem (perhaps outdated, competition, or technical issues). Without filtering, the positive and negative masked each other.
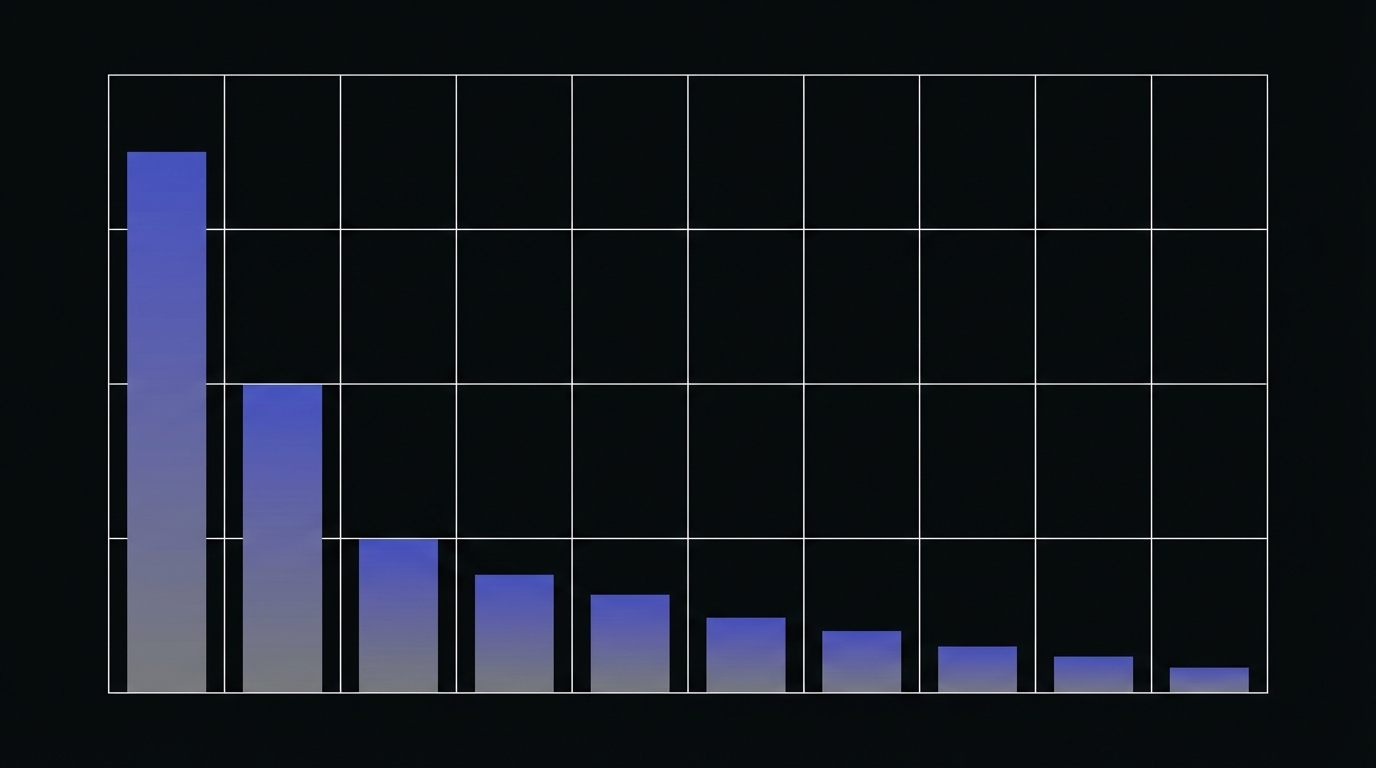
CTR Expectations by Position
Understanding expected CTR by position helps identify anomalies:
| Position | Expected CTR | Notes |
|---|---|---|
| 1 | 39.8% | Captures more clicks than positions 3-10 combined |
| 2 | 18.7% | About half of position 1 |
| 3 | 10.2% | Top 3 capture ~69% of all clicks |
| 4 | 7.2% | |
| 5 | 5.1% | Below this, CTR drops significantly |
| 6 | 4.4% | |
| 7 | 3.0% | |
| 8 | 2.1% | |
| 9 | 1.9% | |
| 10 | 1.6% |
Moving up one position increases CTR by approximately 32%. Position 5-10 represents the "quick win zone"—improving from position 8 to position 3 could increase CTR from 2% to 10% (5x improvement).
AI Overview Impact: For queries where Google shows AI Overviews, CTR drops significantly—by approximately 61% compared to non-AIO queries. If your CTR seems unusually low for a good position, check if AI Overviews appear for that query.
Query Analysis: What Your Keywords Reveal
Everyone looks at their top 10 queries. The real insights are often in queries #50-500.
Beyond Top Queries
Your top queries are important—they drive the most traffic. But they're also:
- Already optimized (you know about them)
- Competitive (harder to improve)
- Mature (less room for quick wins)
The opportunity is in the queries you're almost winning:
- Queries #20-100: High impressions, medium position
- Position 5-10 queries: Close to page 1 or just made it
- Growing queries: Volume increasing over time
- Unexpected queries: Ranking for things you didn't target
Query Pattern Analysis
Pattern #1: High Impressions, Low CTR, Position 5-10
Data example:
- Query: "project management software comparison"
- Impressions: 8,500/month
- Position: 7.2
- CTR: 2.1%
- Clicks: 178
Meaning: You're visible (showing up often) but not ranking high enough or not compelling enough. This is a high-opportunity query because improving position from 7.2 to 3-4 would dramatically increase clicks.
Opportunity: Content optimization + technical improvements to push into top 5
Priority: High—quick win potential with significant impact
Expected outcome: Moving from position 7.2 to 3.5 could increase CTR from 2.1% to 8%, yielding ~680 clicks (4x increase)
Pattern #2: High Impressions, Very Low CTR, Position 1-3
Data example:
- Query: "best email marketing tools"
- Impressions: 12,000/month
- Position: 2.1
- CTR: 4.2%
- Clicks: 504
Meaning: Great ranking but poor CTR compared to typical position 2 CTR (15-20%). This suggests:
- Your title/meta description isn't compelling
- Competitors have rich results (star ratings, FAQ)
- Query intent mismatch (searchers want something different)
- SERP features are capturing clicks (Featured Snippet, People Also Ask)
Opportunity: Title/meta optimization or schema markup to add rich results
Priority: High—you're losing clicks you should be getting
Expected outcome: Improving CTR from 4.2% to even 10% (still below typical) would yield 1,200 clicks (2.4x increase)
Pattern #3: Low Impressions, High CTR, Top Position
Data example:
- Query: "best project management for architecture firms"
- Impressions: 180/month
- Position: 1.8
- CTR: 32%
- Clicks: 58
Meaning: Low-volume, specific keyword where you dominate. High CTR indicates strong relevance and compelling presence.
Opportunity: Expand into related higher-volume keywords. This query proves you have topical authority—use it as a springboard.
Priority: Medium—already winning here, but can expand reach
Action: Find related queries like "project management for construction," "architecture firm software," etc.
Pattern #4: Growing Impressions, Stable Position
Data example:
- Query: "AI project management"
- Impressions: 450/month → 1,200/month → 2,800/month (over 3 months)
- Position: 5.2 → 5.1 → 5.3 (stable)
- CTR: 4.1% → 4.3% → 4.0% (stable)
Meaning: Query volume is increasing (trending topic). Your stable position means you're riding the wave of increased interest.
Opportunity: Double down on this topic. Create more related content, optimize existing content, build topical clusters around AI in your niche.
Priority: High—growing opportunity with momentum
Action: Create comprehensive content on this trending topic to capture growing search volume and potentially improve position.
Query Intent Alignment
One of the most powerful insights from query analysis is intent mismatch:
Informational queries → Should go to blog/guide content
- "how to choose project management software"
- "what is agile project management"
- "project management best practices"
Commercial queries → Should go to product/service/comparison pages
- "best project management software"
- "asana vs monday.com"
- "project management tools for small business"
Transactional queries → Should go to product/pricing/signup pages
- "buy project management software"
- "asana pricing"
- "monday.com free trial"
Navigational queries → Should go to specific pages users seek
- "asana login"
- "trello dashboard"
- Brand-specific searches
Misalignment example (actual problem):
Your product pricing page ranks for "how to manage projects effectively" (informational query):
- High impressions (query has volume)
- Low CTR (wrong content for intent)
- High bounce rate (users didn't find what they wanted)
- No conversions (wrong funnel stage)
Fix: Create a blog post targeting this informational query, and let the pricing page focus on commercial/transactional queries.
The Long-Tail Story
Sort your queries by clicks and look at queries #100-1000. These are your long-tail:
Characteristics:
- Very specific queries
- Low individual volume (5-50 clicks/month each)
- High intent (specific = knows what they want)
- Less competitive
- High aggregate value (1,000 queries × 20 clicks = 20,000 clicks)
What long-tail success indicates:
- Topical authority: You rank for many variations, showing depth
- Content comprehensiveness: Your content covers many specific angles
- Natural content: Long-tail rankings come from comprehensive, natural writing
What weak long-tail indicates:
- Thin content (only targeting main keyword)
- Lack of topical depth
- Opportunity to expand content comprehensiveness
Branded vs Non-Branded: A Critical Filter
Always separate branded from non-branded queries in your analysis. The CTR difference is dramatic:
- Branded queries: ~9.4% average CTR
- Non-branded queries: ~0.4% average CTR
- Difference: ~23x higher CTR for branded
Mixing branded and non-branded data skews your analysis. A "good" overall CTR might mask poor non-branded performance (where growth opportunity lies), or a "poor" overall CTR might undervalue strong brand recognition.
Page Analysis: What Your URLs Reveal
While queries tell you what people search for, pages tell you what's actually working on your site.
Page Performance Patterns
Pattern #1: Top Pages Dominate (80/20 rule)
Most sites follow the Pareto principle:
- 20% of pages drive 80% of traffic
- This is normal and expected
- Not a problem unless concentrated in just 1-2 pages
What this tells you:
- Focus optimization on these top performers (highest ROI)
- Small improvements to top pages = big traffic impact
- These pages set your site's performance baseline
Action: Optimize these top 20% pages religiously:
- Keep content fresh (update regularly)
- Monitor for ranking drops (immediately address)
- Expand related topics (capitalize on authority)
- Improve CTR (maximize the visibility you have)
Pattern #2: Many Pages, Little Individual Traffic
Characteristics:
- 500 pages in GSC
- Top page: 10,000 clicks/month
- Pages #100-500: 5-50 clicks/month each
What this tells you:
- Long-tail content strategy
- Each page contributes small amount individually
- Aggregate value is high (500 pages × 25 clicks = 12,500 clicks)
- Good for topical authority
Action:
- This pattern is positive for SEO (breadth of coverage)
- Don't expect every page to be a home run
- Focus on clusters: groups of related pages supporting pillar content
- Consider consolidating very low performers (< 10 clicks/month with little engagement)
Pattern #3: Declining Top Pages
Red flag: Your best pages are losing traffic
Example:
- Top page historically: 15,000 clicks/month
- Last 3 months: 12,000 → 10,000 → 8,500
What this tells you:
- Content decay (information is outdated)
- Competitor improvements (they've created better content)
- Technical issues (page speed degraded, mobile usability problems)
- Algorithm impact (your page no longer matches ranking criteria)
Action:
- Highest priority to fix—these pages have proven value
- Content refresh (update stats, add new information, improve comprehensiveness)
- Technical audit (speed, mobile, Core Web Vitals)
- Backlink analysis (did you lose authoritative links?)
- SERP analysis (what do top 3 competitors have that you don't?)
Page Type Performance Analysis
Different page types serve different purposes and have different performance profiles:
Homepage:
- Usually high brand traffic
- Low non-brand traffic (not targeting specific queries)
- High CTR for brand queries
- Should be entry point but often not top traffic driver
Blog posts:
- Varied performance (some winners, many moderate)
- Informational queries
- Long-tail strength
- Growth driver for most content strategies
Product pages:
- Commercial queries ("best," "review," "vs")
- Lower CTR (comparison shopping behavior)
- Higher value per click (closer to conversion)
- Should target transactional keywords
Category pages:
- Broader category terms ("project management software" not "best PM for agencies")
- Challenging to rank (competitive)
- High value when successful (gateway to multiple products)
Comparison pages:
- Strong commercial intent ("X vs Y," "alternatives to Z")
- Often high CTR (specific intent)
- Can capture bottom-of-funnel traffic
Action: Analyze performance by page type to identify strengths and weaknesses:
- Blog posts growing, product pages flat → focus on product optimization
- Homepage has high traffic but low engagement → improve internal linking and conversion paths
Unexpected Page Rankings
Sometimes pages rank for queries you didn't specifically target. This is valuable insight.
Scenario #1: Opportunity to optimize
Your blog post "10 Project Management Mistakes" ranks #8 for "common project management challenges" (1,200 impressions/month) even though you didn't optimize for it.
Action:
- Add section specifically addressing "common challenges"
- Optimize title to include this phrase
- Add related content depth
- This is low-hanging fruit—you're already close
Scenario #2: Keyword cannibalization?
Two of your pages rank for the same query:
- Page A: Position 6 (500 impressions)
- Page B: Position 12 (800 impressions)
Neither is dominating, and combined you have significant impressions but split position.
Action:
- Decide which page should rank (more comprehensive?)
- Consolidate if appropriate, or differentiate the pages
- Use internal linking to signal to Google which page is primary
- Consider canonical tag if content is very similar
Scenario #3: Pages with no traffic
You have pages indexed but receiving <10 clicks/month over 3 months.
Possible reasons:
- Not ranking for any meaningful queries (not optimized)
- Targeting queries with no volume (keyword research problem)
- Duplicate content issues (cannibalization or thin content)
- Technical issues (slow, poor mobile experience)
Action:
- Audit these pages: Are they necessary?
- If valuable topics: optimize, expand, improve
- If not valuable: consider consolidation or deletion (remove low-quality pages)
Click-Through by Page Type
CTR expectations differ by page type:
Product pages: 3-6% typical
- Users are comparison shopping
- Looking at multiple results
- CTR naturally lower
Blog posts: 5-12% typical
- Information seeking
- More likely to click on relevant title
- Higher CTR for well-optimized titles
Homepage: 40-60% for brand, 3-8% for non-brand
- Brand searches have very high CTR
- Non-brand CTR similar to other pages
Understanding these baselines helps you identify outliers:
- Product page with 1.5% CTR → Investigate title/meta
- Blog post with 2% CTR → Major optimization opportunity
Device and Geographic Stories
GSC lets you filter by device and country, revealing additional dimensions to your performance story.
Mobile vs Desktop Performance Gaps
What gaps reveal:
Gap #1: Mobile position lower than desktop
- Cause: Mobile usability issues or mobile-first indexing problem
- Evidence: Check Mobile Usability report for errors
- Action: Fix mobile UX issues, improve mobile speed, ensure mobile-friendly design
Gap #2: Mobile CTR lower than desktop
- Cause: Titles too long (truncated on mobile), mobile SERP crowding with features
- Evidence: Titles > 60 characters, SERP features appearing more on mobile
- Action: Optimize titles for mobile (shorter, front-load keywords), consider mobile-specific meta descriptions
Gap #3: Mobile traffic much higher than desktop
- Reality: This is normal—most searches are mobile now
- Action: Ensure mobile experience is optimized (this is your primary traffic source)
Gap #4: Desktop CTR much higher than mobile
- Cause: Often due to SERP layout differences—mobile has more features, less space
- Action: Understand this is partly structural; optimize for mobile SERP specifically
Example analysis:
Query: "project management software"
Desktop: Position 3.2, CTR 12%, Clicks 840
Mobile: Position 4.8, CTR 6%, Clicks 1,200

Story: Mobile position is worse (mobile UX issues?) and mobile CTR is lower (title truncation or SERP features?), but mobile volume is so high that mobile still drives more clicks.

Action: Improve mobile position to match desktop (check mobile usability), optimize title for mobile display.
Geographic Performance Stories
Pattern #1: Unexpected country traffic
You're a U.S. business but getting significant traffic from:
- UK (similar language, similar intent)
- Canada (geographic proximity)
- Australia (same language)
Decision points:
- Opportunity: Should you expand to serve these markets?
- Problem: Are they your target audience? If not, can you better target U.S.?
Action:
- If opportunity: Add international targeting, currency options, localized content
- If problem: Use hreflang tags, improve U.S.-specific targeting
Pattern #2: Low performance in target geography
You want to rank in the UK, but:
- U.S. traffic: 10,000 clicks/month
- UK traffic: 200 clicks/month
Causes:
- Not ranking in UK search results (Google.co.uk vs Google.com)
- Content not localized (American English, U.S.-specific references)
- Technical setup (server location, domain TLD)
Action:
- International SEO optimization
- Localized content (UK English, UK examples)
- Technical setup (hreflang, geotargeting in GSC)
- UK-specific backlinks
Pattern #3: Geographic CTR variations
Same query, same position, different countries:
- U.S.: CTR 8%
- UK: CTR 12%
- Canada: CTR 6%
Reasons:
- Different title resonance in different cultures
- Different competition levels by geography (UK less competitive = higher CTR)
- Different SERP features by country
Action:
- Analyze what works in high-CTR geographies
- Create location-specific titles/meta descriptions if possible
- Understand structural differences (competition, SERP layout)
September 2025 Data Change
If you're comparing historical data, note that Google stopped supporting the &num=100 parameter on September 12, 2025. Before this date, impressions were inflated by automated crawlers. Data from September 13, 2025 onward reflects actual user visibility for positions 1-20 only. When doing YoY comparisons spanning this date, account for this baseline shift.
Key Takeaways: From Data to Insights
Transform your approach to GSC data:
-
Data without context is just numbers. Always look at metrics together, not in isolation. A click drop means nothing without understanding impressions, CTR, and position context.
-
Always ask "why?" not just "what?" Move beyond reporting ("clicks increased 15%") to analysis ("clicks increased because we improved position on commercial keywords").
-
Look for patterns across time (trends). Single data points are noise. Look for sustained trends of 7+ days before taking action.
-
Distinguish signal from noise. Use the 7-day rule, magnitude assessment (25%+ = signal), and metric correlation to identify meaningful changes.
-
Understand seasonal patterns. Establish your seasonal baseline with 12+ months of data. Use YoY comparisons to remove seasonal noise and see true growth.
-
Four metrics tell interconnected story. Analyze them together. Each pattern (clicks up + impressions up + CTR flat, etc.) tells a specific story with specific actions.
-
Query patterns reveal opportunities. High impressions + position 5-10 = quick win opportunity. High position + low CTR = optimization opportunity.
-
Page patterns reveal strengths and weaknesses. 80/20 distribution is normal. Focus on top performers and declining pages. Understand page type differences.
-
Device and geography add nuance. Don't just look site-wide. Mobile vs desktop and geographic filters reveal additional optimization opportunities.
-
Build cause-and-effect narratives. Use evidence, not assumptions. Test causation with the "what if" test. Correlation doesn't prove causation.
The fundamental shift: Stop treating GSC as a reporting tool and start using it as an analysis tool. The numbers tell stories—learn to read them.
Conclusion & Next Steps
You now have a framework for understanding what your GSC data is really telling you—reading patterns instead of just numbers, distinguishing signal from noise, building cause-and-effect narratives, and recognizing the specific stories your four metrics tell.
What you've learned:
- The difference between reporting and analysis
- How to distinguish meaningful signals from random noise
- Techniques for identifying seasonal patterns and using YoY comparisons
- The causation vs correlation framework for understanding why changes happen
- How to read four-metric patterns and diagnose specific issues
- Query pattern analysis to find high-opportunity keywords
- Page performance patterns and what they reveal
- Device and geographic analysis for deeper insights
Next steps to apply this framework:
-
Analyze your last month's performance: Export your GSC data and identify the primary four-metric pattern. What story does it tell?
-
Find 3 high-opportunity queries: Filter for queries with high impressions (1,000+) and position 5-10. These are your quick wins.
-
Investigate your top declining page (if any): If one of your top traffic pages is trending down, make it your top priority to understand why and fix it.
-
Set up your seasonal baseline: Export 12-24 months of data and create a monthly summary. Identify your seasonal patterns so you can distinguish expected changes from problems.
-
Build a causation timeline: Next time you see a significant change, document what happened on your site and externally around that date. Build evidence-based causation narratives instead of assumptions.
Ready to turn these insights into action?
Now that you understand what your data is telling you, the next step is mastering filters to segment your data and reveal hidden patterns. Learn how to use filters and comparisons to analyze specific sections of your site, device types, and query categories in GSC Filters & Comparisons Complete Tutorial.
Once you've mastered filtering, you'll be ready to systematically identify high-impact optimization targets in GSC Queries Report: How to Find Your Biggest Opportunities.
For a foundation on the basics of the Performance Report, start with How to Read Google Search Console Performance Report.
For detailed guidance on the complete GSC interface, see The Complete Guide to Google Search Console Analysis.
Related Articles:
- GSC Queries Report: How to Find Your Biggest Opportunities
- Pages Report Analysis: Identifying Your Best and Worst Performers
- How to Interpret GSC Click-Through Rate Data
Last updated: January 2026