GSC Data Limitations & Workarounds
Understand Google Search Console's data limitations including the 1,000 row limit, anonymous queries, 16-month retention, and data lag. Learn workarounds.

Google Search Console Data Limitations: Complete Guide (2026)
Introduction
The #1 complaint about Google Search Console: "Where's the rest of my data?"
Data vanishes after row 1,000. GSC clicks don't match Google Analytics sessions. Specific queries disappear. Google Search Console is powerful, but doesn't show everything—by design.
Understanding GSC's limitations prevents wrong conclusions and reveals when to supplement GSC with other tools. Know what GSC doesn't show to fill gaps strategically instead of making decisions on incomplete information.
This guide explains major GSC data limitations, why they exist, and how to work around them.
Related: How to Set Up Google Search Console | How to Read Your GSC Performance Report | The Complete Guide to Google Search Console Analysis
The 1,000 Row Limit: Your Biggest Frustration
What Is the 1,000 Row Limit?
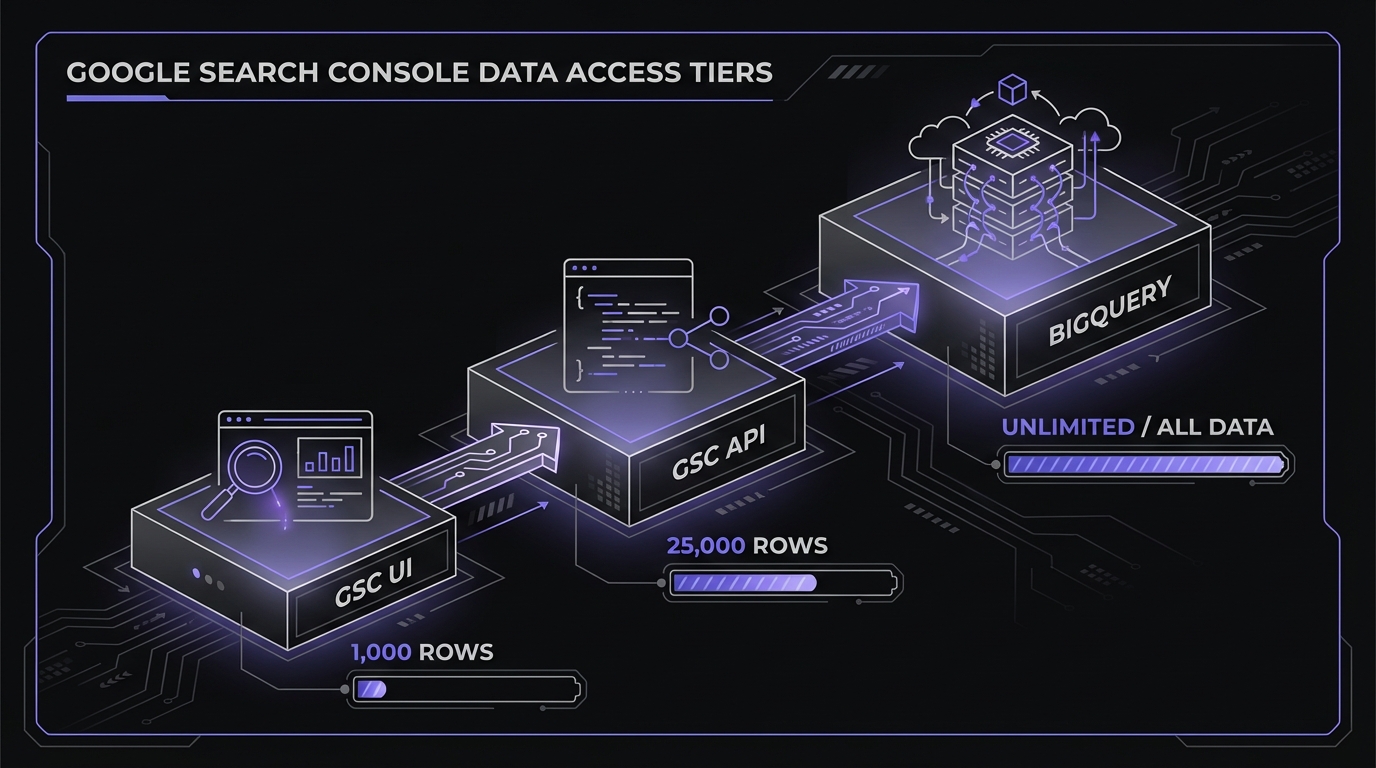
Any GSC report—queries, pages, countries, devices—shows maximum 1,000 rows in the UI. Applies whether viewing in dashboard or exporting to CSV.
What's important:
- NOT a sampling issue. You're seeing the top 1,000 rows sorted by selected metric (clicks, impressions, CTR, or position).
- Data exists beyond 1,000 rows. GSC has all data; doesn't display it in UI.
- Applies to every tab. Queries, Pages, Countries, Devices, Search Appearance—all limited to 1,000 rows.
- Exports also limited. CSV downloads limited to 1,000 rows.
"Top 1000 results" at the bottom means you're seeing a fraction of your actual search presence.

Why This Matters
For small sites, the 1,000 row limit isn't a problem. For larger sites, it's significant:
- Large sites have thousands of pages and tens of thousands of queries. E-commerce site with 5,000 products might rank for 50,000+ queries.
- Seeing only a fraction of search presence. 10,000 queries with impressions = seeing top 10%.
- Low-traffic pages and long-tail queries invisible. Niche queries collectively driving significant traffic don't show if they miss the top 1,000.
- Comprehensive audits difficult. Can't analyze what you can't see.
Example: Site has 25,000 queries with impressions in last 3 months. Queries export shows top 1,000 by clicks. 24,000 queries hidden.
Workarounds for the 1,000 Row Limit
Several practical workarounds exist:
1. Filter Data to See Different Segments
The 1,000 row limit applies to each filtered view separately. Apply filters to see 1,000 different rows per segment. Learn advanced filtering in GSC filters and comparisons.
Example: Filter by subdirectory
- Filter pages containing
/blog/→ See top 1,000 blog pages - Filter pages containing
/products/→ See top 1,000 product pages - Filter pages containing
/guides/→ See top 1,000 guide pages
Example: Filter by query type
- Filter queries containing your brand name → See top 1,000 branded queries
- Filter queries NOT containing your brand name → See top 1,000 non-branded queries
- Filter queries containing "how to" → See top 1,000 informational queries
This approach lets you see thousands of rows by viewing different segments, though it requires manual work.
2. Use the GSC API
The Google Search Console API allows up to 25,000 rows per request—25 times more than the UI export.
Benefits:
- Access to 25,000 rows instead of 1,000
- Automated data extraction (no manual exports)
- Historical data storage (bypass the 16-month limit)
- Combine data from multiple date ranges and properties
Considerations:
- Requires technical setup (OAuth, API credentials)
- May require coding knowledge (Python, JavaScript, etc.)
- Worth the effort for sites with significant traffic
Tools that use GSC API:
- Google Looker Studio (formerly Data Studio)
- SEO monitoring platforms (Ahrefs, Semrush, Sistrix)
- Custom scripts and dashboards
If you're running a serious SEO operation on a site with thousands of pages, setting up API access is one of the highest-ROI investments you can make.
3. Use Google Looker Studio
The Looker Studio connector provides up to 50,000 rows per day per site—a significant upgrade from the UI's 1,000 row limit without requiring coding.
How it works:
- Connect GSC as a data source in Looker Studio
- Create a table visualization with your desired dimensions
- Export or analyze directly in the dashboard
Limitations:
- Still subject to some sampling on large sites
- 50,000 daily row cap (refreshes each day)
- Requires Looker Studio familiarity
For sites needing more than 50,000 rows, combine Looker Studio with API access or BigQuery.
4. BigQuery Bulk Export (Maximum Data Access)
For the most complete data access, Google's BigQuery bulk export removes most sampling limitations:
What BigQuery provides:
- Access to anonymized query metrics (as NULL values—you see the clicks/impressions even without the query text)
- Historical data beyond 16 months (if you set up export before data expires)
- No daily row limits
- Raw data for custom analysis
Setup requirements:
- Google Cloud Platform account
- BigQuery project configured
- GSC property linked to BigQuery export
- SQL knowledge for querying data
Real-world difference: One analysis found the API returned ~40,000 unique queries while BigQuery showed 350,000—nearly 9x more data for the same site.
5. Change Your Sort Metric
Here's a clever trick: the 1,000 rows you see depend on which metric you're sorting by.
- Sort by Clicks: See the top 1,000 pages/queries by clicks
- Sort by Impressions: See the top 1,000 pages/queries by impressions
- Sort by CTR: See the top 1,000 pages/queries by click-through rate
- Sort by Position: See the top 1,000 pages/queries by average position
These often show completely different data sets.
Example: A query with 10,000 impressions but only 50 clicks (0.5% CTR) might appear in the top 1,000 when sorted by impressions, but not when sorted by clicks. By switching between sort options, you can see different segments of your data.
6. Export Multiple Filtered Segments
Combine filtering with exports to build a comprehensive dataset:
- Export branded queries (1,000 rows)
- Export non-branded queries (1,000 rows)
- Export by subdirectory (1,000 rows each)
- Combine in Google Sheets or Excel
This manual approach is time-consuming but works for sites that haven't set up API access yet.
Pro tip: Set up a monthly process to export key segments. Over time, you'll build a complete historical database that overcomes both the 1,000 row limit and the 16-month retention limit.
Anonymous Queries: The Missing Search Terms
A 2023 Ahrefs study analyzing 146,741 websites and nearly 9 billion clicks found that 46% of all clicks go to anonymous queries—search terms Google doesn't reveal in your reports. This isn't a minor data gap; it's nearly half your traffic.
What Are Anonymous Queries?
Look at the total impressions shown at the top of your Performance Report. Now export your queries data and sum the impressions from all visible queries. Notice the difference?
That gap represents anonymous queries—search terms that Google doesn't reveal in your reports.
Anonymous queries are:
- Queries that don't meet Google's privacy threshold
- Usually rare queries (searched very few times)
- Queries that could potentially identify individual users
- Visible in aggregate (you see the total impressions/clicks) but not the actual search terms
What you see: "Your site received 100,000 total impressions" What queries show: 85,000 impressions across 950 visible queries Anonymous impressions: 15,000 (15%)
How Much Data Is Anonymous?
The percentage of anonymous queries varies dramatically based on your site type, traffic level, and keyword portfolio:
- Established sites with good rankings: 5-15% of impressions are anonymous
- New or small sites: Can be 30-50% of impressions anonymous
- Niche topics with long-tail queries: Higher percentage of anonymous data
- Broad topics with popular queries: Lower percentage of anonymous data
The more long-tail and specific your content, the more anonymous queries you'll have. This is because rare searches (e.g., searched only once or twice) don't meet Google's frequency threshold for display.

Voice search compounds the problem. With 20% of global searches and 50% of US searches happening via voice daily, these conversational queries are often too unique to meet Google's frequency threshold—making them invisible in your reports.
Why Google Hides Query Data
Google anonymizes query data for several privacy and quality reasons:
- Privacy protection – Preventing identification of individual users based on unique searches
- Low-frequency queries – Queries searched fewer than X times (Google doesn't publish the exact threshold)
- Sensitive content – Medical, legal, financial, or personally identifiable queries
- Google's privacy policies – Compliance with privacy regulations (GDPR, CCPA, etc.)
This is a feature, not a bug. Google is protecting user privacy, which is good for searchers even if it's frustrating for SEO professionals.
How to Estimate Your Anonymous Query Impact
You can calculate exactly how much of your data is anonymous:
Step-by-step calculation:
- Go to Performance Report
- Note "Total impressions" displayed at the top (e.g., 100,000)
- Export queries data (maximum 1,000 rows)
- Sum impressions from all exported queries (e.g., 85,000)
- Calculate:
(Total - Exported Sum) / Total × 100 = % anonymous
Example calculation:
- Total impressions: 100,000
- Sum of exported query impressions: 85,000
- Anonymous impressions: 15,000
- Anonymous percentage: 15,000 / 100,000 = 15%
Note: If you have more than 1,000 queries, you'll need to account for the 1,000 row limit. The actual anonymous percentage might be lower than your calculation suggests, because some visible queries are hidden by the row limit.
Working with Anonymous Queries
Since you can't see the actual query terms, here's how to work around this limitation:
Accept what you can't change: You'll never see all query data. That's okay. Focus on the 85-95% you can see.
Analyze pages receiving anonymous traffic:
- Switch to the Pages tab
- Sort by impressions or clicks
- Look for pages with strong performance that don't show corresponding queries
- These pages are likely ranking for many anonymous long-tail queries
Cross-reference with Google Analytics:
- GA shows landing pages receiving organic traffic
- Compare GA landing pages to GSC pages
- Pages with GA traffic but invisible GSC queries indicate anonymous query traffic
Use keyword research tools:
- Tools like Ahrefs, Semrush, or Google Keyword Planner
- Research potential queries for pages with anonymous traffic
- Identify patterns in what users might be searching
16-Month Data Retention: Historical Limits
What Is the 16-Month Limit?
Google Search Console stores performance data for only 16 months from the current date. After 16 months, your data is permanently deleted and cannot be recovered.
Important clarifications:
- The 16-month limit applies to Performance Report data (clicks, impressions, queries, pages)
- Other reports have different retention periods:
- Index Coverage: Historical data retained longer
- Core Web Vitals: 90 days only
- URL Inspection: Current status only (no historical data)
- There's no way to access data older than 16 months within GSC
- You can't request historical data from Google Support
Why This Matters
The 16-month limitation creates several challenges for SEO analysis:
Year-over-year comparisons are limited: You can't compare January 2025 to January 2024 if you're looking at data in April 2026 (more than 16 months after January 2024).
Long-term trend analysis is impossible: Want to see how your organic traffic has grown over 3 years? GSC won't help.
Historical baseline establishment requires external storage: You can't establish multi-year baselines for traffic patterns, seasonality, or algorithm update impacts.
Algorithm update analysis is time-limited: If a major Google update happened 18 months ago, you can't analyze its impact using GSC data.
This is particularly frustrating for:
- New SEO managers joining established websites (no historical context)
- Analyzing long-term ROI of SEO investments
- Understanding seasonal patterns across multiple years
- Recovering from traffic drops that occurred more than 16 months ago
Workaround: Export Data Regularly
The solution is simple but requires discipline: export your GSC data regularly and store it externally.
Recommended approach: Monthly exports
Create a recurring calendar reminder to export data on the 1st of each month. This builds a permanent historical database that overcomes the 16-month limit.
What to export monthly:
-
Performance Report data:
- Queries (top 1,000 by clicks)
- Pages (top 1,000 by clicks)
- Countries (all countries)
- Devices (all devices)
- Date range: Previous month or last 30 days
-
Summary metrics:
- Total clicks
- Total impressions
- Average CTR
- Average position
-
Index Coverage metrics:
- Valid pages count
- Errors count
- Warnings count
- Excluded pages count
-
Core Web Vitals:
- Good URLs count
- Needs improvement count
- Poor URLs count
Storage options:
- Google Sheets (easy, accessible, free)
- Excel files on cloud storage (Dropbox, OneDrive, Google Drive)
- Data warehouse (BigQuery, Snowflake) for enterprise
- CSV files in version-controlled folders
Automation options:
- GSC API + Google Sheets (using Apps Script)
- Python scripts with automated monthly runs
- Third-party tools (Supermetrics, Windsor.ai)
- SEO platforms with automated GSC data storage
Data Freshness: The 2-3 Day Lag
GSC Data Is Not Real-Time
If you published a page today and want to see how it's performing in search, you'll need to wait. Google Search Console data typically lags 2-3 days behind real-time search activity.
What this means in practice:
- Today is January 21, 2026
- The latest data available in GSC is from January 18-19
- Data from January 20-21 hasn't been processed yet
Why the lag exists:
- Google processes billions of searches daily across the globe
- Data validation and quality checks take time
- Privacy filtering (anonymous queries) happens during processing
- Aggregation across multiple data centers adds delay
- Spam and bot filtering requires analysis before data appears
Implications of the Data Lag
You can't immediately see the impact of changes:
- Published a new page? Wait 2-3 days to see if it's indexed and getting impressions
- Updated title tags? Wait 2-3 days to see CTR impact
- Fixed technical issues? Wait 2-3 days to see results
A/B tests need to account for lag:
- If you change titles on Monday, don't check results until Thursday
- Be patient with experiments—immediate validation isn't possible
Real-time rank tracking requires different tools:
- GSC shows aggregated, delayed data
- Rank trackers (Ahrefs, Semrush) provide daily snapshots
- Manual searches show current rankings (but are personalized)
"Did my update work?" requires patience:
- Don't panic if you don't see changes immediately
- Wait at least 3-5 days before evaluating impact
- Look for trends over weeks, not days
When You Need Real-Time Data
If the 2-3 day lag is unacceptable for your use case, consider these alternatives:
Rank tracking tools: Ahrefs, Semrush, AccuRanker, and others provide daily position checks for specific keywords (updated overnight).
Google Analytics: Traffic data appears within 24-48 hours, faster than GSC. Use GA to see immediate traffic impact of changes.
Manual searches: Search Google for critical queries to see current rankings. Remember that results are personalized and may not reflect what others see.
Server logs: See Googlebot crawl activity in real-time through server log files.
Impression Threshold: The "Not Enough Data" Message
Minimum Impression Requirements
Google Search Console won't show data for pages or queries that don't meet a minimum impression threshold. The exact threshold is unknown (estimated between 10-25 impressions), but it means low-traffic content simply won't appear in your reports.
Where you'll see this:
URL Inspection Tool:
- "No data available" for newly published pages
- "Data not available yet" for low-traffic pages
- No performance metrics until threshold is met
Performance Report:
- Low-traffic pages missing from Pages list entirely
- Long-tail queries with minimal searches don't appear in Queries report
- Even if you had clicks, they won't show without sufficient impressions
Search Appearance:
- Rich results with low impressions aren't shown
- Schema implementations on low-traffic pages won't appear
Working Around the Impression Threshold
For new pages: Be patient
- Newly published content takes time to accumulate impressions
- Wait days or weeks for data to appear
- Index the page first using URL Inspection → Request Indexing
For low-traffic pages: Aggregate
- Use broader filters to see grouped data
- Filter by subdirectory instead of individual page
- Analyze categories rather than specific URLs
Use Google Analytics instead:
- GA tracks all visits regardless of traffic level
- See which low-traffic pages receive organic search visits
- Cross-reference with GSC for queries on pages that do meet threshold
Focus on pages that matter:
- Pages below the impression threshold are low-impact by definition
- Prioritize optimization of pages visible in GSC (higher traffic potential)
- Low-traffic pages matter collectively, not individually
Average Position: The Most Misunderstood Metric
How Average Position Is Calculated
Average position is a weighted average of your ranking positions across all impressions for a query or page.
Calculation example:
- Your page ranks #3 for 100 impressions
- Your page ranks #8 for 50 impressions
- Average position = (3 × 100 + 8 × 50) / 150 = (300 + 400) / 150 = 4.7
Important details:
- Includes ALL impressions, even if the user didn't scroll to see your result
- Position is based on your highest-ranking result on each SERP
- Personalization affects position (location, device, search history)
- Different users see different positions for the same query
Why Average Position Is Misleading
Average position is useful, but it's frequently misunderstood and misused. Here's why it can be misleading:
Issue #1: Fluctuating Rankings Look Like a Single Position
Reality: Your ranking fluctuates
- Monday-Wednesday: You rank #2
- Thursday-Sunday: You rank #8
What GSC shows: Average position #5
The problem: You're never actually ranking #5. The average hides the volatility. You might think you're stable at #5 when you're actually bouncing between #2 and #8.
Issue #2: Different Positions for Different Users
Rankings vary based on:
- Location: Users in New York see different results than users in Los Angeles
- Device: Mobile rankings differ from desktop rankings
- Personalization: Search history affects results
- Time of day: Results can shift throughout the day
Average position masks all this variation, showing a single number that no individual user actually experiences.
Issue #3: Multi-Keyword Pages
One page often ranks for hundreds of different keywords:
- Rank #1 for "best running shoes for beginners"
- Rank #5 for "running shoes"
- Rank #15 for "athletic footwear"
- Rank #25 for "Nike shoes"
Average position aggregates across all these keywords. The resulting number (e.g., #12) is meaningless for understanding your actual rankings on any specific query.
How to Use Average Position Correctly
Average position isn't useless—you just need to use it properly. For a deeper understanding of this metric, see our complete guide on position tracking and what average position really means.
DO use for trends:
- Is average position improving or declining over time?
- Did the algorithm update help or hurt positions?
- Is seasonality affecting rankings?
DON'T use for absolute ranking:
- Avoid saying "We rank #3 for keyword X" based on average position
- Don't make exact positioning claims in reports
- Don't treat it as a consistent ranking
DO use for segmentation:
- Compare branded vs non-branded query average positions
- Compare mobile vs desktop average positions
- Compare different content types or categories
DO use for benchmarking:
- This month vs last month average position change
- This quarter vs last quarter trends
- Before vs after optimization comparisons
Better Alternatives for Position Tracking
If you need accurate, consistent position data:
Rank tracking tools: Ahrefs, Semrush, AccuRanker, and others check rankings from consistent locations and devices daily.
Manual search checks: Search Google yourself for priority keywords (use incognito mode to reduce personalization).
GSC for directional trends only: Use average position to see if things are generally improving or declining.
Focus on clicks and impressions: These are what actually matter. Rankings are a means to an end (traffic).
Other Important Limitations
Click vs Session Discrepancies
One of the most common questions: "Why don't my GSC clicks match my Google Analytics sessions?"
The answer: They measure different things and will never match perfectly.
GSC counts clicks:
- User clicks on your site in search results
- Click is counted immediately
- Doesn't matter if the page loads or user stays
Google Analytics counts sessions:
- User lands on your site and GA tracking fires
- Requires page to load and JavaScript to execute
- User must allow tracking (no ad blockers, etc.)
Common discrepancies:
| Scenario | GSC Click | GA Session |
|---|---|---|
| User clicks multiple search results for your site | Multiple clicks | One session |
| User hits back button before page loads | Yes | No |
| Browser blocks GA tracking | Yes | No |
| User disables JavaScript | Yes | No |
| Bot clicks (filtered differently in each tool) | Maybe | Maybe |
| User clicks then page redirects | Yes | Maybe |
Typical variance: Expect GSC clicks to be 10-30% higher than GA organic sessions. This is normal.
Mobile vs Desktop Data Caveat
Google uses mobile-first indexing, which affects how data appears in GSC:
- Most sites show heavy mobile skew (70-90% mobile traffic)
- Desktop data may be less complete for mobile-first indexed sites
- Always segment by device to see the full picture
- Mobile performance is now more important than desktop for most sites
Pro tip: When analyzing performance, always check the device segmentation. A page might perform well on mobile but poorly on desktop (or vice versa).
Country Data Limitations
Country data in GSC is based on Google's estimate, which isn't always accurate:
- IP-based location: Can be wrong if users use VPNs
- Google account settings: Users can set preferred country
- Travelers: Someone traveling abroad shows as searching from that country
- Small countries: May be aggregated into regions
Use country data for trends, not precision: It's useful for understanding your international presence generally, but don't treat it as exact user location data.
Search Type Completeness
GSC tracks different search types separately, with varying data completeness:
- Web search: Most complete data, this is your primary focus
- Image search: Less complete, many anonymous queries, impressions less reliable
- Video search: Limited data unless you have significant video result presence
- News search: Only appears if your site is in Google News index
Each search type is tracked separately. Make sure you're viewing the right search type for your analysis.
Rich Results Data
The Search Appearance filter shows which rich result types your site triggers, but coverage is incomplete:
Reliably tracked:
- FAQ
- How-to
- Product
- Recipe
- Review
- Job Posting
May not appear in Search Appearance:
- Other schema types
- Custom structured data
- Some Google-generated rich results
If you've implemented schema but don't see it in Search Appearance, it doesn't necessarily mean it's not working—it might just not be in GSC's tracked list.
How to Fill the Gaps: Using Other Tools
Google Search Console is powerful, but it's not complete. Here's how to combine GSC with other tools for comprehensive search visibility.
GSC + Google Analytics
What GSC shows: Search queries, impressions, click-through rates, average positions
What GA shows: User behavior after landing (bounce rate, time on page, conversions, user flow)
Combined power: Complete picture from impression → click → landing → conversion
How to connect them:
- Link GSC to GA4 in GA admin settings
- View GSC queries in GA alongside behavior metrics
- Identify high-impression, low-click queries (optimize title/description)
- Identify high-click, low-conversion queries (optimize landing page)
GSC + Rank Tracking Tools
What GSC shows: Average position (aggregated, variable, directional)
What rank trackers show: Consistent daily position checks from specific locations
Use rank trackers for:
- Priority keyword position tracking
- Competitor position comparison
- Precise positioning (not averaged)
- SERP feature tracking
Use GSC for:
- Overall position trends at scale
- Query discovery (find new keywords to track)
- Performance metrics (clicks, impressions) that rank trackers don't have
GSC + Keyword Research Tools
What GSC shows: Queries you already rank for (even if position #50)
What keyword tools show: Queries you could target (search volume, competition, related terms)
Combined approach:
- Export GSC queries to find what you rank for
- Use keyword tools to expand list with related queries
- Identify content gaps (high-volume queries you don't rank for)
- Prioritize optimization based on existing rankings + opportunity
GSC + Screaming Frog / Technical SEO Tools
What GSC shows: What Google sees (indexed pages, indexing errors)
What crawl tools show: What exists on your site (all pages, links, technical issues)
Gap analysis reveals:
- Pages not indexed that should be
- Pages indexed that shouldn't be
- Crawl budget waste
- Technical barriers to indexing
GSC + Log File Analysis
What GSC shows: Indexed pages and their performance
What log files show: All Googlebot activity (crawled pages, frequency, status codes)
Advanced insights:
- Crawl budget allocation issues
- Pages crawled but not indexed
- Crawl frequency patterns
- Bot vs user behavior comparison
Key Takeaways
Essential points about GSC data limitations:
-
1,000 row limit is biggest practical limitation. Use filtering, change sort metrics, or implement GSC API to see beyond 1,000 rows.
-
Anonymous queries normal. Expect 5-15% impressions for established sites, 30-50% for new or niche sites. Never see all query data.
-
16-month data retention requires regular exports for historical analysis beyond 16 months. Set up monthly exports now.
-
2-3 day data lag means no real-time analysis. Wait 3-5 days to see impact of changes.
-
Average position for trends, not absolute rankings. Don't claim "We rank #3" based on average position. Track directional changes over time.
-
GSC clicks won't match GA sessions. Normal—they measure different things. Expect 10-30% variance.
-
Impression thresholds hide low-traffic content. New pages and low-traffic URLs won't appear until meeting minimum impressions.
-
Combine GSC with other tools for complete picture. GSC + GA + rank trackers + keyword research = comprehensive visibility analysis.
-
Set realistic expectations. GSC is powerful but doesn't show everything. Understanding limitations prevents misinterpretation.
Conclusion & Next Steps
You now understand major GSC data limitations, why each exists, how to work around them, and when to use other tools.
This prevents common mistakes:
- Over-interpreting average position as exact rankings
- Panicking when GSC and GA don't match
- Making decisions on incomplete data (1,000 row limit)
- Losing historical context (16-month retention)
Your Action Plan
This week:
- Calculate anonymous query percentage
- Check if hitting 1,000 row limit on queries or pages
- Set calendar reminder for monthly GSC exports
This month: 4. Export key GSC data segments and store externally 5. Set up GSC integration in GA4 6. Learn GSC filters to overcome 1,000 row limit
This quarter: 7. Evaluate GSC API access (if >1,000 pages or queries) 8. Implement systematic approach combining GSC with other tools 9. Build historical data tracking for long-term trends
Related articles:
- GSC Filters and Comparisons: A Complete Tutorial – Filter data effectively and overcome 1,000 row limit
- Position Tracking in GSC: What Average Position Really Means – Deep dive into position data
- How to Read Your GSC Performance Report (Beginner's Guide) – Understand data with limitations in mind
Ready to extract maximum insights from the data you do have? Now that you understand GSC's limitations, learn how to use filters, comparisons, and segmentation to uncover actionable SEO opportunities in your Search Console data.
CTA Button: Master GSC Filters & Comparisons →
Last updated: January 2026