GSC Filters & Comparisons Tutorial
Master GSC filters to uncover actionable SEO insights. Learn query, page, device filters, date comparisons, regex patterns, and advanced combinations.

Google Search Console Filters: Complete Tutorial (2026)
Introduction
Generic GSC data tells you almost nothing. Filtered GSC data tells you everything.
The default Performance Report shows aggregate data across all queries, pages, devices, and locations—useful for overview, rarely actionable for SEO improvements.
Filters transform Google Search Console from reporting tool to analysis tool. Blog content vs product pages? Filter by subdirectory. True organic performance without brand inflation? Exclude brand terms. Mobile experience issues? Segment by device.
You'll learn all GSC filter types, date comparisons for trends, query and page filtering strategies, regular expressions for advanced matching, multi-filter combinations for deep segmentation, and practical workflows to implement immediately.
New in 2025-2026: AI-Powered Filtering
Google introduced an experimental AI-powered configuration feature in the Performance report. Describe the analysis you want in natural language—"show me non-brand mobile queries from the US with position between 5 and 15"—and GSC automatically applies the filters, comparisons, and metric selections. This makes advanced analysis accessible without memorizing filter combinations, though understanding manual filtering remains valuable for complex segmentation.
The Basics: Understanding GSC Filter Types
Where to Find Filters
- Navigate to Performance in the left sidebar
- Click "+ New" button near the top
- Select filter type from the menu
[Visual Placeholder: Screenshot showing the "+ New" filter button location in GSC interface]
GSC filters persist until cleared. Filters applied days ago remain active, causing confusion when data looks different. Check for active filters (purple badges beneath "+ New") before analyzing.
Clear filters: Click "X" on each badge, or "Clear all" for multiple filters.
The Three Filter Categories
- Query filters - Filter by search term or keyword
- Page filters - Filter by URL or page path
- Attribute filters - Filter by Country, Device, or Search Appearance
Query filters show search behavior. Page filters show site structure performance. Attribute filters show optimization opportunities for specific segments.
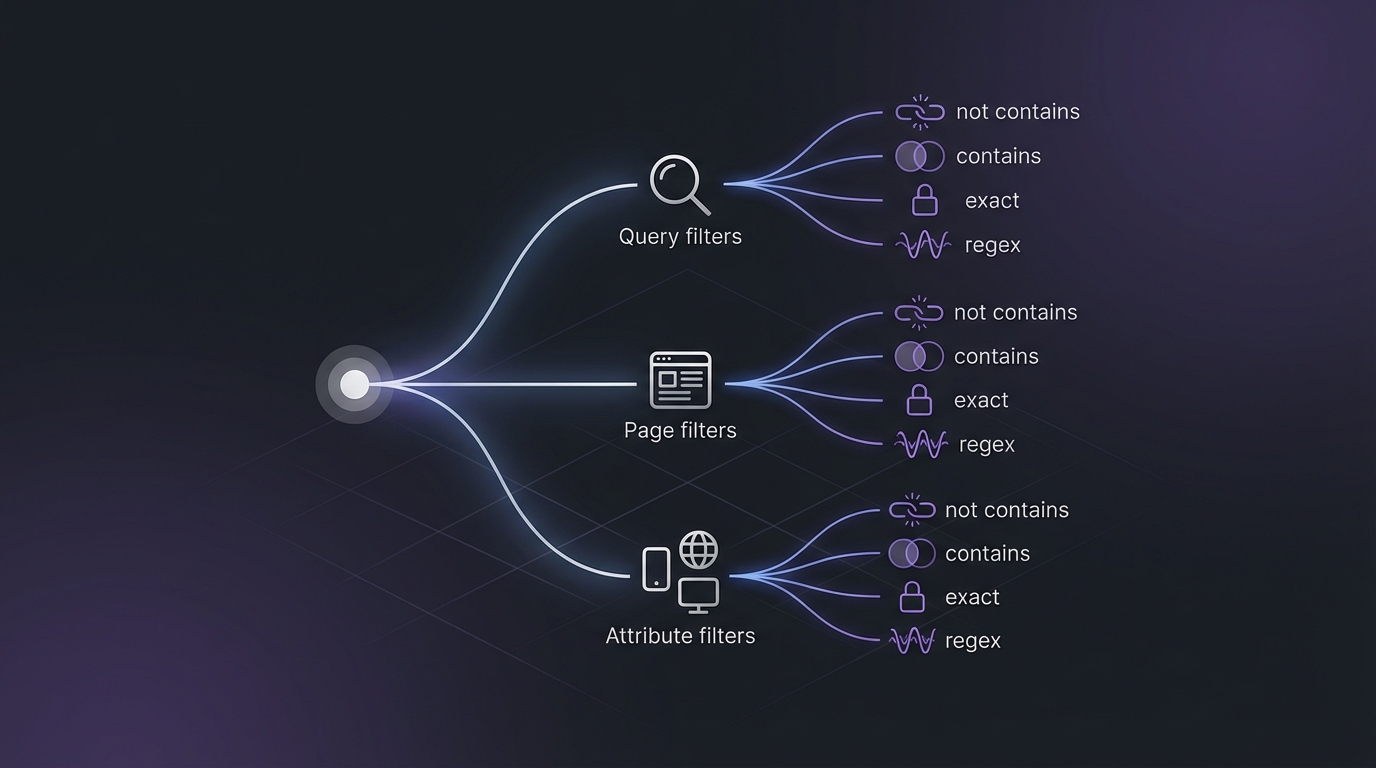
Filter Match Types
- Queries containing / Page contains - Partial match (most commonly used). "shoes" matches "running shoes", "shoe sizing", "best shoes"
- Queries not containing / Page doesn't contain - Exclude matches. NOT containing "brand" excludes all queries with your brand name
- Exact query / Exact URL - Must match exactly. Exact query "running shoes" only matches that specific query
- Custom (regex) - Pattern matching using regular expressions.
^buymatches queries starting with "buy"
Most analyses use "containing" or "not containing" filters. Save "exact" for specific investigations. Learn regex for advanced filtering power.
[Visual Placeholder: Screenshot showing filter match type options in dropdown menu]
Query Filters: Finding Specific Search Terms
Query Filter Use Cases
Use Case #1: Brand vs Non-Brand Analysis
The filter: Queries containing "yourbrand"
What it shows: All branded search performance
Brand queries have higher CTR, better positions, and different user intent than non-brand queries. Mixing them masks your true organic content performance.
Example insight: Overall average position 8.2, but branded position 1.5 and non-branded 15.3 shows very different performance for brand awareness versus content marketing. The aggregate 8.2 hides this.
How to implement:
- Click "+ New" → Query
- Select "Queries containing"
- Enter your brand name
- Switch to "Queries NOT containing" + your brand name
- Compare the two data sets
November 2025 Update: Google added an automatic "Branded queries" filter to the Performance Report. Instead of manually entering brand variations, GSC now auto-detects branded queries for your verified property. Find it in the filter dropdown—it handles misspellings, abbreviations, and variations automatically. Manual filtering still works for edge cases or custom brand term definitions.
[Visual Placeholder: Screenshot showing brand vs non-brand comparison side-by-side with metrics]
Use Case #2: Product Category Performance
The filter: Queries containing "running shoes"
Captures all related queries: "best running shoes", "women's running shoes", "running shoes for flat feet", "affordable running shoes". Complete category-level performance metrics.
Example insight: Filtering for "running shoes" reveals 2,847 total queries (GSC shows 1,000), 15,234 clicks, average position 12.4. Visibility exists but ranking positions show optimization opportunity.
Use Case #3: Question Queries
The filter: Queries containing "how to"
Question queries indicate informational search intent. Missing traffic here means content gaps.
Try: "what is", "why do", "when should", "where to", "who is"
Example insight: 3,500 impressions but 45 clicks (1.3% CTR). Content exists and gets shown, but titles/metas don't match question intent.
Use Case #4: Exclude Brand Queries
The filter: Queries NOT containing "yourbrand"
Your content marketing effectiveness metric. Brand queries represent people who already know you. Non-brand queries represent new audience discovery.
Example insight: Total clicks: 10,000. Non-brand clicks: 2,500. 75% of traffic is branded searches. Content marketing needs improvement to capture non-brand traffic.
Use Case #5: Local Queries
The filter: Queries containing "near me"
For physical locations or local markets, these represent high-intent local customers.
Variations: "near me", your city name, state name, neighborhood names, "in [location]" (requires regex)
Example insight: "Coffee shop near me" drives 1,200 impressions, you rank position 18. Google Business Profile or local SEO needs work.
Advanced Query Filtering with Multiple Filters
Filters combine with AND logic—all conditions must be met for highly specific segments.
Example combination:
- Query containing "shoes"
- AND Query containing "men"
- AND Query NOT containing "yourbrand"
Men's shoe queries without brand inflation or gendered variations.
[Visual Placeholder: Screenshot showing multiple query filters combined with results]
Common Query Filter Mistakes
Mistake #1: Using "exact query" when you mean "containing"
Exact query matching is restrictive. "Exact query: running shoes" only shows that precise query, missing "best running shoes", "men's running shoes", etc. Use "containing" for most analyses.
Mistake #2: Not excluding brand when analyzing content performance
Measure content marketing effectiveness by excluding brand queries. Otherwise brand searches inflate results.
Mistake #3: Forgetting active filters
Check for active filters (purple badges) before analyzing data.
Page Filters: URL-Level Analysis
Page Filter Use Cases
Use Case #1: Subdirectory Performance
The filter: Page containing "/blog/"
Separates blog from product pages, documentation, homepage. Shows content marketing ROI.
Common variations: /blog/, /products/, /category/, /docs/, /resources/
Example insight: Blog: 8,500 clicks/month, position 14.2. Product pages: 2,300 clicks, position 6.8. Blog drives volume, products rank better. Apply product optimization strategies to blog content.
[Visual Placeholder: Screenshot showing subdirectory filter with performance metrics]
Use Case #2: Individual Page Deep Dive
The filter: Page exactly matching "https://example.com/specific-page"
Single page performance with all driving queries.
How to use:
- Apply exact page filter
- Switch to "Queries" tab
- See all queries driving traffic
- Identify optimization opportunities
Example insight: Main product page ranks for 247 queries. Top query drives 45% of traffic. Next 10 combine for 30%. Remaining 236 are low-volume long-tail. Focus optimization on top performers.
Use Case #3: Template-Level Analysis
The filter: Page containing "/product/"
What it shows: All product pages performance
Why it matters: If all your product pages use the same template, analyzing them together reveals template-level optimization opportunities. Fix the template and improve hundreds of pages at once.
Variations by site type:
- E-commerce:
/product/,/collection/ - SaaS:
/features/,/solutions/ - Publishing:
/author/,/tag/,/category/ - Service business:
/services/,/locations/
Example insight: All product pages average 8.2% CTR, but your homepage and category pages average 12.5% CTR. The product page template likely has title/meta issues. Fix the template to improve hundreds of product pages simultaneously.
Use Case #4: Exclude Homepage
The filter: Page NOT containing "https://example.com/$"
What it shows: Non-homepage performance
Why it matters: Homepages typically rank for brand queries and have different optimization goals than content pages. Excluding them reveals your content depth performance.
Note: For exact homepage exclusion, you'll need regex: ^https://example\.com/?$
Example insight: Including homepage: 25,000 clicks, position 5.8. Excluding homepage: 8,500 clicks, position 16.3. Your homepage carries your overall metrics. Content pages need significant improvement.
Use Case #5: Specific File Type
The filter: Page containing ".pdf"
What it shows: PDF search performance
Why it matters: If you publish whitepapers, guides, or documentation as PDFs, this shows whether they're getting search visibility.
Variations:
.pdf- PDF documents.doc- Word documents.ppt- PowerPoint presentations/images/- Image subdirectory
Example insight: Your PDFs get 1,200 impressions but only 12 clicks (1% CTR). PDFs likely have poor titles in SERPs. Consider creating dedicated landing pages for each PDF instead of linking directly to the file.
Combining Page + Query Filters
The real power comes from combining page and query filters together.
Example 1: Blog content about specific topic
- Page containing "/blog/"
- AND Query containing "SEO"
What it shows: Blog posts ranking for SEO-related queries
Why it matters: You can measure topic authority for your blog by topic area.
[Visual Placeholder: Screenshot showing combined page + query filter with results]
Example 2: Product pages with commercial intent
- Page containing "/product/"
- AND Query containing "buy"
What it shows: Product pages capturing bottom-of-funnel commercial queries
Why it matters: These are your money pages capturing money queries. High performance here directly impacts revenue.
Example 3: Documentation ranking for purchase queries
- Page containing "/docs/"
- AND Query regex:
buy|purchase|price|cost
What it shows: Documentation pages accidentally ranking for commercial queries
Why it matters: This might be keyword cannibalization. Your product pages should rank for commercial queries, not docs. This filter reveals content organization problems.
Date Comparisons: Trend Analysis
Single date ranges show snapshots. Date comparisons show stories: performance trends, seasonal patterns, impact of specific changes, statistical significance.
Date comparison answers: "Is what we're doing working?"
Date Comparison Options
Access via "Compare" button (top right).
[Visual Placeholder: Screenshot showing "Compare" button and date range selector]
Compare any two custom date ranges, use quick presets (Last 7 days vs Previous period, Last 28 days vs Previous period), or compare non-contiguous periods (December 2025 vs December 2024).
Strategic Date Comparisons
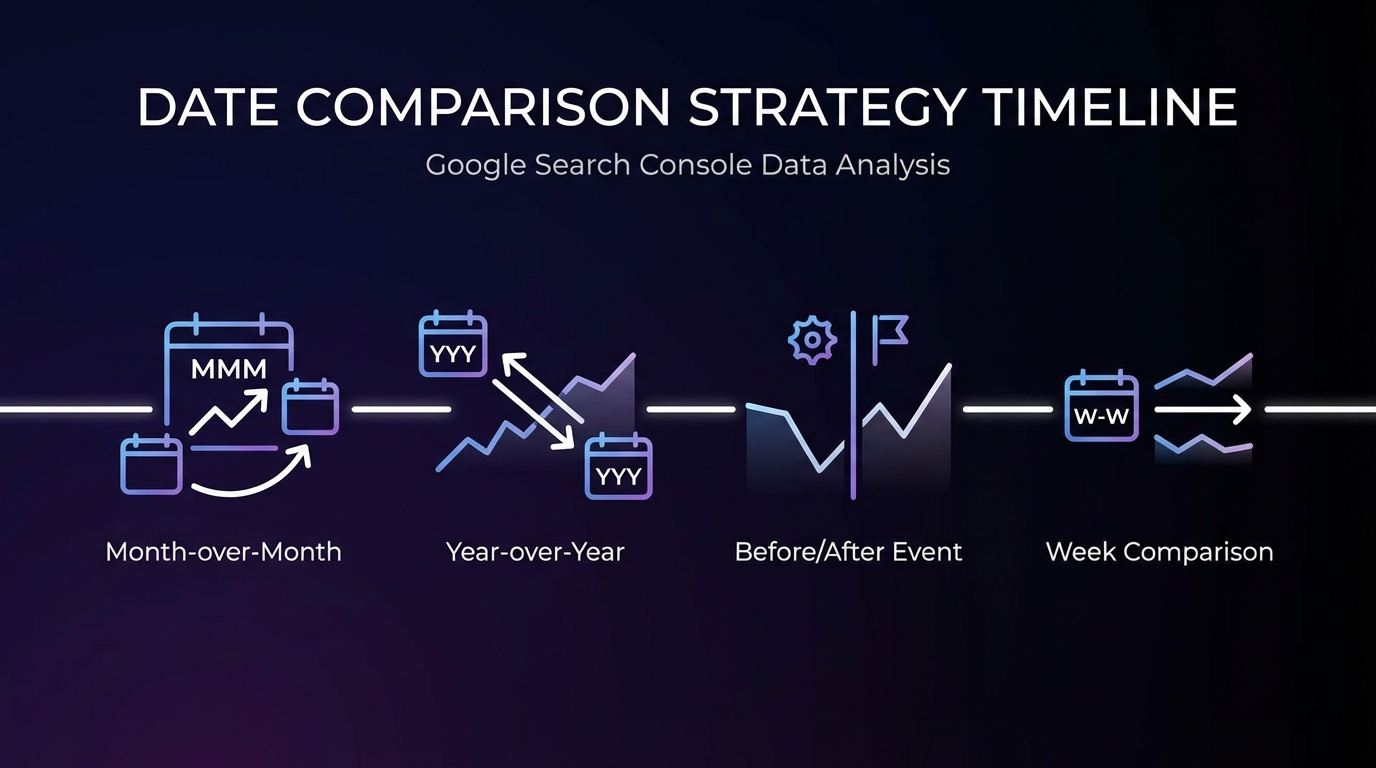
Comparison #1: Last 28 Days vs Previous 28 Days
Purpose: Month-over-month trend analysis
What to look for:
- Percentage changes in clicks, impressions, CTR, position
- Green arrows (improvement) or red arrows (decline)
- Which metric changed most significantly
When to use: Regular monthly reporting to track progress
Example insight:
- Clicks: +15.3% (green arrow)
- Impressions: +8.2% (green arrow)
- CTR: +6.4% (green arrow)
- Position: -0.8 (red arrow, but position declining by <1 is normal fluctuation)
Interpretation: Performance improving across the board. Clicks growing faster than impressions means CTR improvement is working.
[Visual Placeholder: Screenshot showing comparison view with arrows and percentage changes]
Comparison #2: Year-Over-Year (Same Period Last Year)
Purpose: Seasonal normalization
What to look for:
- True growth after accounting for seasonality
- Whether seasonal patterns remain consistent
- Year-over-year growth rates
When to use: For any business with seasonal traffic patterns (most businesses have some seasonality)
Example: Compare December 1-31, 2025 vs December 1-31, 2024
Example insight:
- December 2025: 15,000 clicks
- December 2024: 12,000 clicks
- YoY growth: +25%
But if you compare December 2025 to November 2025 and see +50%, that's not growth—that's Christmas shopping season. YoY comparison reveals the true +25% growth.
[Visual Placeholder: Chart showing year-over-year comparison with seasonal pattern illustrated]
Comparison #3: Before/After Specific Event
Purpose: Measure impact of specific changes
Examples of events to measure:
- Site redesign
- Algorithm update (Google core update)
- Content refresh project
- Technical SEO fixes (site speed improvements, mobile optimization)
- Schema implementation
- Major content publication
How to set up:
- Identify the event date
- Choose equal time periods before and after (e.g., 30 days before, 30 days after)
- Compare the two periods
- Account for lag time (changes may take 1-2 weeks to show impact)
Example insight:
Before schema implementation (Jan 1-30):
- Clicks: 8,500
- Impressions: 125,000
- CTR: 6.8%
After schema implementation (Feb 1-28):
- Clicks: 10,200 (+20%)
- Impressions: 128,000 (+2.4%)
- CTR: 8.0% (+1.2 percentage points)
Interpretation: Schema markup improved CTR by displaying rich results. Same impressions (visibility) but better CTR means more clicks from the same traffic.
[Visual Placeholder: Chart showing before/after event comparison with clear impact visible]
Comparison #4: Different Weeks of the Month
Purpose: Identify weekly patterns and day-of-week effects
What to look for:
- Beginning of month vs end of month patterns
- Consistent weekly rhythms
- Anomalies worth investigating
When to use: Understanding traffic patterns for content scheduling and optimization timing
Example insight: Week 1 of every month shows 15% higher traffic than Week 4. Users may be conducting research early in the month for end-of-month purchases. Schedule important content publications for Week 1 to maximize visibility.
Reading Comparison Data
GSC comparison view shows:
- Green arrows = improvement (higher clicks, impressions, CTR; lower position number)
- Red arrows = decline (lower clicks, impressions, CTR; higher position number)
- Percentage change = relative change
- Absolute change = actual number difference
Both percentage AND absolute changes matter:
- +100% sounds impressive, but if it's 1 click to 2 clicks, it's not meaningful
- +5% might seem small, but if it's 10,000 to 10,500 clicks, that's 500 additional clicks
[Visual Placeholder: Annotated screenshot showing how to read comparison metrics]
Common Comparison Mistakes
Mistake #1: Comparing Unequal Time Periods
Wrong: Last 7 days vs Last 14 days
Why it's wrong: You're comparing total counts from different time spans. Of course 14 days has more clicks than 7 days.
Right: Last 7 days vs Previous 7 days
Why it's right: Equal time periods allow percentage comparison to be meaningful.
Also consider: Holidays, events, weekends. Comparing a week with a holiday to a normal week isn't apples-to-apples.
Mistake #2: Not Accounting for Seasonality
Wrong: January 2026 vs December 2025
Why it's wrong: Most businesses see different search behavior around holidays. Comparing December (holiday season) to January (post-holiday) measures seasonality, not performance.
Right: January 2026 vs January 2025
Why it's right: Comparing same month year-over-year accounts for seasonal patterns.
Mistake #3: Reading Too Much Into Small Numbers
Example: Position improved from 12.5 to 11.8 (-0.7)
The mistake: Celebrating a "ranking improvement"
The reality: Position is a weighted average and fluctuates naturally. Changes under 1.0 are typically normal fluctuation, not true ranking improvements.
Rule of thumb:
- Position changes <1.0 = normal fluctuation
- Position changes 1.0-3.0 = potential real change, monitor
- Position changes >3.0 = significant change worth investigating
Similarly for clicks:
- 5% change on 10 clicks (0.5 clicks) = not meaningful
- 5% change on 10,000 clicks (500 clicks) = very meaningful
Always consider both percentage change AND absolute numbers.
Device, Country, and Search Appearance Filters
Beyond query and page filters, GSC offers attribute-based filtering that reveals specific optimization opportunities.
Device Segmentation
Mobile vs Desktop vs Tablet Analysis
Mobile-first indexing means Google predominantly uses the mobile version of your site for ranking. Understanding device-level performance is critical.
Common patterns you'll find:
- Higher mobile traffic - Most sites see 60-80% mobile traffic
- Lower mobile CTR - Smaller screens and more competition above the fold typically result in lower mobile CTR
- Different queries on mobile vs desktop - Mobile users often use different search terms ("near me" on mobile, detailed research queries on desktop)
[Visual Placeholder: Screenshot showing device filter options with performance breakdown]
Device Filter Use Cases
Use Case #1: Identify mobile-specific optimization opportunities
How:
- Filter by Device = "Mobile"
- Sort by Clicks descending
- Identify top mobile pages
- Check mobile usability for these pages
- Test mobile experience (page speed, layout, tap targets)
Use Case #2: Find desktop-only ranking pages
How:
- Compare Desktop vs Mobile performance for the same page filter
- Look for pages with significantly better desktop position
Example insight: Your blog posts rank position 8.5 on desktop but position 15.3 on mobile. Possible causes:
- Mobile page speed issues
- Mobile layout problems
- Intrusive interstitials on mobile
- Poor mobile content experience
Use Case #3: Understand device preference by query type
Example combinations:
- Device = "Mobile" + Query containing "near me"
- Device = "Desktop" + Query containing "comparison"
- Device = "Mobile" + Query containing "quick"
Insight: Different devices correlate with different user intent. Optimize content format and CTAs for the dominant device.
[Visual Placeholder: Chart showing mobile vs desktop CTR comparison by query type]
Country Segmentation
Geographic performance analysis reveals international opportunities and targeting verification.
Country Filter Use Cases
Use Case #1: International SEO Audit
Questions to answer:
- Which countries drive the most traffic?
- Which countries have high impressions but low clicks (opportunity)?
- Which countries have surprisingly strong performance (expansion opportunity)?
How to analyze:
- Go to Countries tab in Performance Report
- Sort by Impressions descending
- Identify countries with high impressions, low clicks, poor CTR
- Filter by those countries specifically
- Check query data - are they searching in different languages?
[Visual Placeholder: Screenshot showing country filter with performance data table]
Use Case #2: Local Business Analysis
For businesses serving specific geographic areas:
- Filter by your target city/region/country
- Verify traffic is coming from the right geography
- Identify "leakage" to other regions (sign of targeting problems)
Example insight: You're a Seattle-based service business. GSC shows 60% of traffic from Washington state, 15% from California, 25% from other states. But you only serve Washington. Either:
- Your site doesn't clearly communicate service area (add location info)
- You rank for generic terms that attract national traffic (refine keyword strategy)
- Opportunity exists for expansion (California shows demand)
Use Case #3: Language/Targeting Verification
For sites with hreflang or international targeting:
- Filter by specific country
- Check queries tab
- Verify queries are in the expected language
- Cross-reference with hreflang implementation
Example insight: Your German site version (example.de) shows Country = "Germany" filter with 30% English queries. Possible issues:
- Hreflang implementation problems
- Missing German translations for key pages
- Targeting settings incorrect in GSC
Example Filter Combinations
Combination #1: UK brand awareness
- Country = "United Kingdom"
- AND Query containing "your brand"
Shows: UK-specific brand search performance
Combination #2: US mobile performance
- Country = "United States"
- AND Device = "Mobile"
Shows: US mobile-specific performance (useful for US market optimization focus)
Search Appearance Filters
Search Appearance filters let you analyze performance for special result types (rich results).
What Is Search Appearance?
When your pages appear in search results with enhanced features (rich results), GSC tracks them separately:
- FAQ rich results
- HowTo rich results
- Product rich results
- Recipe rich results
- Video results
- Review snippets
- Job postings
- And more
Note: You'll only see Search Appearance filter options if you actually have pages appearing with these result types.
[Visual Placeholder: Screenshot showing Search Appearance filter options]
Search Appearance Use Cases
Use Case #1: Rich Result Performance
The filter: Search Appearance = "FAQ Rich Result"
What it shows: Performance of pages displaying FAQ schema
Why it matters: Measures the actual impact of your schema implementation
How to analyze:
- Filter by Search Appearance = "FAQ Rich Result"
- Note CTR for these results
- Clear filter and check overall CTR
- Calculate the difference
Example insight:
- Pages with FAQ schema: 12.5% CTR
- Overall site average: 8.2% CTR
- Lift from FAQ schema: +4.3 percentage points (+52% relative increase)
This proves FAQ schema implementation is worth the effort. Roll it out to more pages.
Use Case #2: Video Search Performance
The filter: Search Appearance = "Video"
What it shows: Video result impressions and clicks
Why it matters: If you publish video content, this measures video SEO effectiveness
Example insight: Your videos get 15,000 impressions in video search but only 300 clicks (2% CTR). Video thumbnails or titles may not be compelling. Test different video preview images and titles.
Use Case #3: Rich Result CTR Comparison
The analysis:
- Filter: Search Appearance = "Product rich result"
- Note CTR
- Compare to similar pages without rich results
Example insight:
- Product pages with schema: 9.5% CTR
- Product pages without schema: 6.2% CTR
- Lift: +3.3 percentage points
Roll out product schema to all product pages.
[Visual Placeholder: Screenshot showing rich result performance comparison with CTR metrics]
Advanced Filtering: Regular Expressions (Regex)
Regular expressions unlock professional-level filtering in Google Search Console. While they have a learning curve, even basic regex knowledge dramatically expands your filtering capabilities.
What Is Regex in GSC?
Regex (regular expressions) is pattern matching syntax that lets you filter for complex patterns that simple "containing" or "exact" matches can't handle.
To use regex in GSC:
- Select filter type (Query or Page)
- Choose "Custom (regex)" from match type dropdown
- Enter your regex pattern
[Visual Placeholder: Screenshot showing regex filter selection in GSC]
Why Use Regex?
- Filter multiple variations at once - Match "shoes OR boots OR sneakers" in one filter
- Exact matching with flexibility - Match queries starting with "buy" without matching "buyer" or "buyback"
- Complex exclusions - Exclude multiple brand variations in one filter
- Professional-level analysis - Segment data in ways basic filters can't achieve
GSC Regex Technical Constraints
Before diving into patterns, know GSC's regex limitations:
- RE2 syntax only - GSC uses Google's RE2 regex engine, not PCRE or JavaScript regex
- No lookaheads/lookbehinds - Patterns like
(?=...)or(?<=...)won't work - 4,096 character limit - Complex patterns must stay under this limit
- Case insensitive - All regex matching ignores case by default
- Unicode limitations - Non-Latin characters work in queries but may fail in URL patterns
These constraints rarely matter for typical SEO analysis, but they explain why some complex patterns from regex tutorials fail in GSC.
GSC Regex Basics
Here are the most useful regex patterns for GSC filtering:
Pattern #1: OR Operator (Multiple Terms)
Regex: shoes|boots|sneakers
Matches: Any query containing shoes OR boots OR sneakers
Use case: Category aggregation without running three separate filters
Example: Instead of filtering for "running shoes" then separately for "running boots", use running (shoes|boots) to capture both.
Pattern #2: Beginning of String
Regex: ^buy
Matches: Queries starting with "buy"
Does NOT match: "buyback", "where to buy" (buy isn't at the start)
Use case: Commercial intent queries that begin with transactional terms
Example: ^(buy|purchase|order) matches any query starting with buy, purchase, or order.
Pattern #3: End of String
Regex: 2026$
Matches: Queries ending with "2026"
Does NOT match: "2026 predictions for 2027"
Use case: Year-specific queries
Example: (2025|2026)$ matches queries ending with either 2025 or 2026.
Pattern #4: Any Character Wildcard
Regex: running.shoes
Matches: "running shoes", "running-shoes", "running_shoes"
Why: The . matches any single character
Use case: Handling variations in punctuation or spacing
Pattern #5: Optional Characters
Regex: womens?
Matches: "women" and "womens"
Why: The ? makes the preceding character optional
Use case: Singular/plural variations
Example: shoes? matches both "shoe" and "shoes"
Pattern #6: Digit Matching
Regex: \d{4}
Matches: Any 4-digit number (2024, 2025, 2026, model numbers, etc.)
Why: \d means "digit", {4} means "exactly 4 times"
Use case: Year queries, model numbers, size queries
Example: size \d{2} matches "size 10", "size 42", etc.
Practical Regex Use Cases for GSC
Use Case #1: All Question Queries
Regex: ^(how|what|why|when|where|who)
Matches: All queries starting with question words
Why it's useful: Captures all informational intent queries in one filter
Analysis:
- Apply this filter
- Check total clicks and impressions
- Calculate as % of total traffic
- Evaluate informational content performance
Example insight: 32% of your impressions come from question queries, but only 8% of clicks. Your informational content gets visibility but titles/metas don't match question intent.
Use Case #2: All Commercial Intent
Regex: buy|purchase|price|cost|cheap|best|review|vs|compare
Matches: Queries containing commercial intent signals
Why it's useful: Captures bottom-of-funnel traffic in one filter
Analysis:
- Apply this filter
- Identify which pages rank for commercial queries
- Verify they're appropriate pages (product pages, not blog posts)
- Check conversion optimization on these pages
Example insight: Your blog posts rank for 45% of commercial intent queries. This might be keyword cannibalization—product pages should rank for commercial queries.
Use Case #3: Exclude Multiple Brand Variations
Regex (in NOT containing): brand|brand\.com|brandname|brand-name
Matches: Excludes all brand variations in one filter
Why it's useful: Some brands have multiple variations (example.com, example, Example, example.io). Exclude all at once.
Example: Your brand is "Acme" but users search for:
- "acme"
- "acme.com"
- "acmetools"
- "acme tools"
Regex: acme|acme\.com|acmetools
Note: The \. escapes the period to match it literally (periods otherwise mean "any character" in regex).
Use Case #4: Specific URL Pattern
Regex: /blog/\d{4}/\d{2}/
Matches: Blog URLs with year/month structure (e.g., /blog/2026/01/)
Why it's useful: Filter for blog posts from specific time periods
Example analysis:
/blog/2026/- All 2026 posts/blog/2025/- All 2025 posts- Compare performance by publication year
Insight: Posts from 2024 average position 18.5. Posts from 2026 average position 8.2. Older content needs refreshing.
Use Case #5: Product SKU Patterns
Regex: SKU-\d{5}
Matches: Product SKU searches (e.g., SKU-12345)
Why it's useful: Identify direct product search traffic
Example insight: You get 2,500 impressions for SKU-format queries but rank poorly (position 25.3). Your product pages likely don't include SKU numbers in visible text. Add SKUs to product titles and descriptions.
[Visual Placeholder: Screenshot showing regex pattern matching query results with highlighted matches]
Advanced Regex Patterns: Real-World Examples
These patterns solve specific business problems:
E-commerce: Size/Color Variations
(size|sz)\s*\d{1,2}|(small|medium|large|xl|xxl)
Captures all size-related queries to analyze sizing content gaps.
A/B Test URL Tracking
\?.*variant=[ab]|\?.*test=
Filters pages with A/B test parameters to measure test page performance separately.
Content Freshness Queries
(2024|2025|2026|latest|new|updated)
Identifies queries where users want current information—prioritize these pages for content refreshes.
Competitor Comparison Queries
vs\s|versus|compared to|alternative
Finds comparison queries where you might create "vs" content or comparison landing pages.
Long-Tail Keyword Detection
^(\S+\s){4,}\S+$
Matches queries with 5+ words. Long-tail queries often have higher conversion intent and lower competition.
Regex Mistakes to Avoid
Mistake #1: Forgetting to escape special characters
Wrong: example.com (matches "exampleXcom", "example-com", etc.)
Right: example\.com (matches only "example.com")
Special characters that need escaping: . $ ^ * + ? { } [ ] \ | ( )
Mistake #2: Overly complex patterns
Wrong: ^(?=.*buy)(?=.*shoes)(?!.*brand).*$ (technically works but impossible to maintain)
Right: Break into multiple simple filters:
- Query containing "buy"
- AND Query containing "shoes"
- AND Query NOT containing "brand"
Mistake #3: Not testing before analyzing
Test your regex patterns using a regex tester (regex101.com) before running analysis. Subtle errors can match unexpected patterns.
Mistake #4: Using regex when simple filters work
Don't use: Custom regex: shoes when "Queries containing: shoes" does the same thing
Regex adds complexity. Use it only when basic filters can't accomplish your goal.
Testing Your Regex
Before running important analysis:
- Go to regex101.com
- Set flavor to "ECMAScript (JavaScript)" (closest to GSC's regex engine)
- Enter your regex pattern
- Test with sample queries
- Verify it matches what you expect
- Then use it in GSC
[Visual Placeholder: Table showing common GSC regex patterns with examples and use cases]
Combining Multiple Filters: Advanced Segmentation
Single filters provide focus. Multiple filters combined provide laser precision.
Filter Combination Strategy
Remember: Filters use AND logic. All conditions must be true for data to appear.
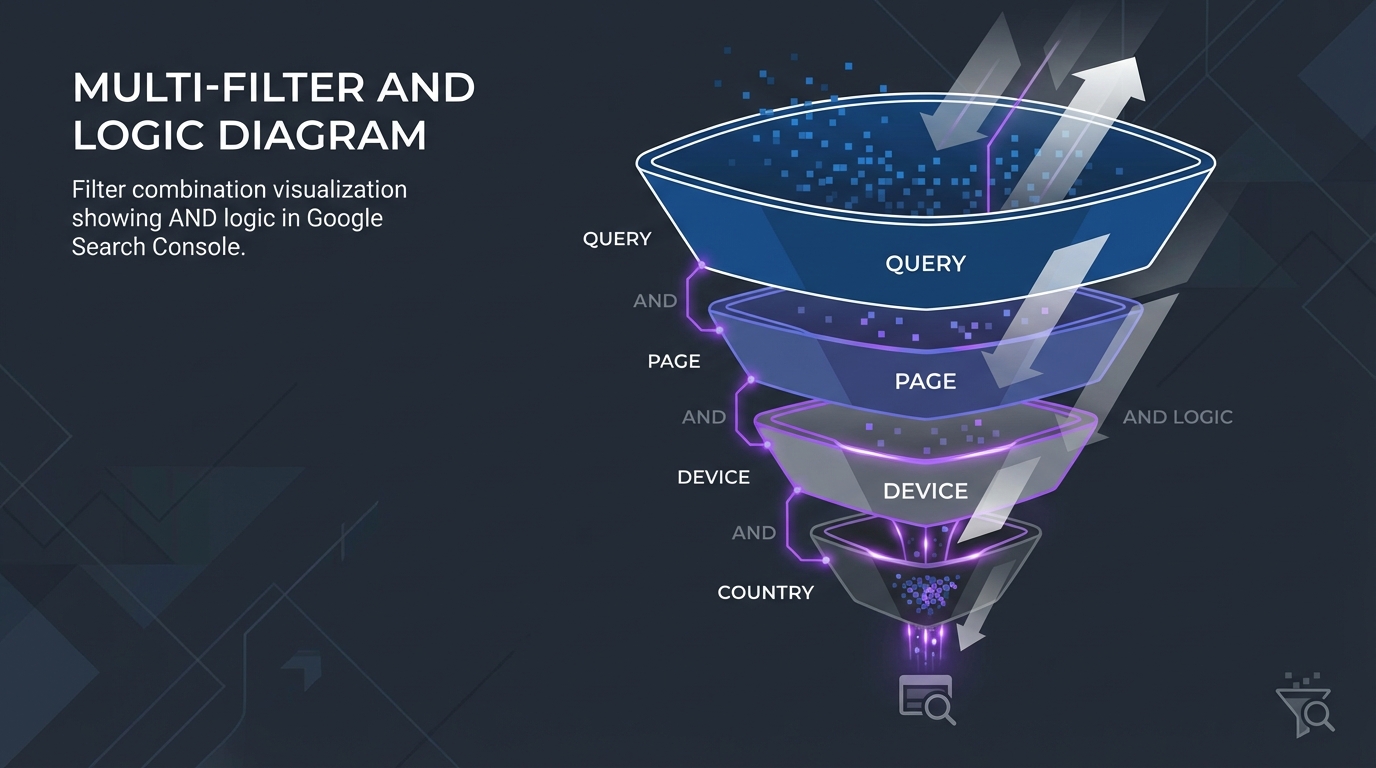
Strategic framework:
- Maximum specificity = maximum insight (but requires enough data volume)
- Too narrow = not enough data (statistical significance problems)
- Too broad = insight dilution (the problem we started with)
Find the balance for your site's traffic volume.
Powerful Filter Combinations
Combination #1: Non-Brand, Mobile, Specific Country
Filters:
- Query NOT containing "brand"
- AND Device = "Mobile"
- AND Country = "United States"
What this shows: US mobile organic performance (excluding brand)
Why this matters: This is your true mobile organic performance in your primary market, without brand inflation
Example insight:
- Overall average position: 8.5
- With these filters: 16.8
- Interpretation: Brand queries and international traffic were masking poor US mobile organic performance
[Visual Placeholder: Screenshot showing complex multi-filter setup with results]
Combination #2: Blog Content, Commercial Intent
Filters:
- Page containing "/blog/"
- AND Query regex:
buy|best|review|vs
What this shows: Blog posts capturing commercial traffic
Why this matters: Identifies potential keyword cannibalization (blog posts ranking instead of product pages for commercial queries)
Example insight: 23 blog posts rank for commercial intent queries. You have product pages that should rank for these queries instead. Check if:
- Product pages exist for these topics
- Product pages are properly optimized
- Internal linking favors blog posts over product pages
Action: Optimize product pages, update internal links to favor products for commercial queries.
Combination #3: Product Pages, Informational Queries
Filters:
- Page containing "/product/"
- AND Query regex:
^(how|what|guide|tutorial)
What this shows: Product pages ranking for informational queries
Why this matters: Another form of keyword cannibalization. Informational content (blog posts, guides) should rank for informational queries, not product pages.
Example insight: Your product pages rank for 45 "how to" queries. User intent mismatch—people asking "how to" questions land on product pages and bounce. Create blog content targeting these queries, optimize product pages for commercial terms only.
Combination #4: Specific Topic, Position Range, Device
Filters:
- Query containing "coffee maker"
- AND Position 5-10 (requires manual review or API access)
- AND Device = "Mobile"
What this shows: Coffee maker queries where you're close to page 1 on mobile
Why this matters: Position 5-10 represents "close but not quite" rankings. Small improvements here yield big traffic gains.
Example insight: 12 queries about coffee makers rank position 5-8 on mobile. These are your quick win opportunities. Optimize for mobile, improve CTR, target featured snippets.
Building Analysis Workflows with Filters
Turn ad-hoc filtering into repeatable workflows.
Example Workflow: Content Audit
Goal: Identify blog posts needing optimization or removal
Steps:
- Filter: Page containing "/blog/"
- Date range: Last 12 months
- Sort by clicks descending
- Export top 100 blog posts
- For each top post:
- Filter: Exact page URL
- Switch to Queries tab
- Identify top driving queries
- Note average position
- Check CTR
- Categorize posts:
- High performers (position <5, good CTR)
- Quick wins (position 5-15, room for improvement)
- Long shots (position >20, may not be worth optimizing)
- Update or remove long shots
[Visual Placeholder: Flowchart showing filter workflow for content audit]
Example Workflow: Mobile Optimization Priorities
Goal: Find mobile optimization opportunities with highest impact
Steps:
- Filter: Device = "Mobile"
- Sort by impressions descending
- Add filter: Position 5-20
- Look for: High impressions + position 5-20 + lower-than-average CTR
- These are pages getting visibility on mobile but underperforming
- Prioritize mobile optimization for these pages
Example results:
- Page A: 12,000 mobile impressions, position 8.5, CTR 4.2% (below average)
- Action: Test mobile usability, improve page speed, optimize title for mobile SERPs
Exporting Filtered Data
Filters make data actionable. Exporting filtered data makes it sharable and combinable.
Why Export?
- Overcome the 1,000 row limit - Export still limited to 1,000 rows but preserves your filtering
- Combine multiple filtered exports - Create comprehensive analysis in Google Sheets
- Create custom reports - Build stakeholder reports with specific segments
- Historical tracking - Export monthly to track trends over time
- Share with team - Send filtered data to colleagues
How to Export
- Apply your filters
- Verify filters are correct (check active filter badges)
- Click Export button (top right of Performance Report)
- Choose format:
- Google Sheets (recommended) - Opens in new Sheet, easy to work with
- Download CSV - Good for import to other tools
Important: The export includes ONLY the currently active filters and currently visible tab (Queries, Pages, Countries, etc.)
[Visual Placeholder: Screenshot showing Export button location and format options]
Export Best Practices
Practice #1: Descriptive naming
Bad names:
- "GSC Export"
- "Untitled spreadsheet"
- "Export 1"
Good names:
- "GSC_Blog_Performance_2026_01"
- "NonBrand_Queries_Desktop_US_Jan2026"
- "Product_Pages_Commercial_Intent_Q1_2026"
Why: You'll have dozens of exports. Descriptive names make them findable and usable months later.
Practice #2: Document filters used
In your Google Sheet, add a tab called "Filters Applied" with:
- Date range
- All active filters
- Purpose of this export
- Date exported
Why: Future you won't remember what filters created this dataset. Document it now.
Practice #3: Regular export schedule
Create a monthly ritual:
- First Monday of every month
- Export key segments (blog performance, product pages, brand vs non-brand)
- Save in organized folder structure
- Track trends over time
Practice #4: Combine exports for comprehensive analysis
Example: Multi-segment analysis
- Export: Page containing "/blog/"
- Export: Page containing "/products/"
- Export: Page containing "/resources/"
- Combine in one Sheet with separate tabs
- Compare subdirectory performance side-by-side
[Visual Placeholder: Screenshot showing Google Sheets with multiple tabs from different filtered exports]
Common Filter Workflows by Use Case
Theory is good. Practical workflows are better. Here are five ready-to-use filter workflows for common SEO tasks.
Workflow #1: Finding Quick Win Opportunities
Goal: Identify pages/queries with high potential for traffic growth with minimal effort
Steps:
- Go to Queries or Pages tab
- Sort by Impressions (descending)
- Look for:
- Average position 5-15 (close to page 1 or bottom of page 1)
- High impressions (>100)
- CTR below average for that position
- Filter out: Query NOT containing "yourbrand"
- Export results
What you've found: Queries where you're getting visibility but not quite winning. Small ranking improvements or CTR optimizations will yield significant traffic gains.
CTR benchmarks by position (approximate industry averages):
| Position | Expected CTR |
|---|---|
| 1 | 28-32% |
| 2 | 15-18% |
| 3 | 10-12% |
| 4 | 6-8% |
| 5 | 4-5% |
| 6-10 | 2-4% |
Use these benchmarks to identify underperforming queries. Position 5 with 2% CTR signals a title/meta problem—you should be getting 4-5%.
Example result:
- Query: "best project management software"
- Impressions: 8,500/month
- Position: 8.5
- CTR: 3.2% (below average for position 8)
Action: Optimize this page to reach position 5-6 and improve CTR. Potential: +200-300 clicks/month.
Workflow #2: Content Gap Analysis
Goal: Find topics where you're getting impressions but not ranking well (content opportunity)
Steps:
- Go to Queries tab
- Filter: Impressions >500
- Filter: Position >10
- Sort by impressions descending
- Analyze: What topics are getting impressions but poor ranking?
- Export for content planning
What you've found: Topics where search demand exists, you're getting some visibility, but you're not ranking well. These are content creation opportunities.
Example result:
- Query: "how to create a marketing budget"
- Impressions: 2,500/month
- Position: 18.5
- Clicks: 35
Action: You have a page ranking poorly for a high-volume query. Either improve the existing page or create comprehensive new content targeting this query.
Workflow #3: Seasonal Performance Check
Goal: Understand seasonal trends to plan for next season
Steps:
- Use date comparison: December 2025 vs December 2024
- Filter by product category or content topic
- Sort by clicks descending
- Identify:
- Which queries grew YoY?
- Which queries declined YoY?
- What new queries appeared this year?
- Export for seasonal planning
What you've found: Seasonal patterns that inform next year's content and optimization priorities
Example result:
- "Christmas gift ideas" queries up 35% YoY
- "last minute gifts" queries up 60% YoY
- "budget Christmas gifts" new query cluster (didn't appear last year)
Action: For next December, publish "last minute" content earlier and add "budget-friendly" angles.
Workflow #4: Mobile Optimization Audit
Goal: Find mobile-specific optimization opportunities
Steps:
- Filter: Device = "Mobile"
- Sort by clicks descending
- For top 20 pages:
- Check mobile usability in GSC
- Test mobile page speed
- Compare mobile vs desktop position
- Filter: Device = "Desktop"
- Sort by clicks descending
- Compare top pages mobile vs desktop
What you've found: Pages with mobile vs desktop performance discrepancies
Example result:
- Top blog post ranks position 6.2 on desktop, 14.8 on mobile
- Mobile page speed: 3.2 seconds (poor)
- Mobile usability: "Text too small to read" warning
Action: Optimize mobile page speed, fix mobile usability issues. Potential: bring mobile ranking closer to desktop ranking.
Workflow #5: International Expansion Research
Goal: Identify countries with opportunity for international expansion
Steps:
- Go to Countries tab
- Sort by impressions descending
- Filter: Countries with >100 impressions but <10 clicks
- For each country:
- Filter by that country
- Switch to Queries tab
- Analyze query language and intent
- Evaluate: Real demand or just random visibility?
What you've found: Countries showing search demand for your topics
Example result:
- Germany: 1,200 impressions, 8 clicks
- Top queries: Mix of English and German
- Average position: 18.5
Action: Research:
- Are German users searching in English or German?
- Do you need German content or just better English content optimization?
- Is the demand significant enough to justify German site version?
[Visual Placeholder: Infographic showing all 5 workflows with step-by-step visual process]
Key Takeaways
Let's recap the essential concepts for mastering GSC filters:
-
Filtering transforms GSC from reporting to analysis - Generic data shows you what happened. Filtered data shows you why and what to do about it.
-
Query + Page filters are most versatile - 80% of your filtering will use query and page filters. Master these first.
-
Date comparisons are essential for understanding trends - Never analyze a single date range in isolation. Always compare to understand if performance is improving or declining.
-
Device, Country, and Search Appearance filters reveal specific opportunities - Mobile vs desktop performance, international opportunities, and rich result impact all require attribute-based filtering.
-
Regex unlocks advanced filtering - Learning basic regex patterns dramatically expands your filtering capabilities. Start with OR operators and beginning/end of string matching.
-
Combine multiple filters for maximum insight - Single filters provide focus. Multiple filters combined provide precision. Find the specificity balance for your traffic volume.
-
Export filtered data to overcome limitations - The 1,000 row UI limit is frustrating but exportable. Export filtered segments and combine them in Google Sheets for comprehensive analysis.
-
Build repeatable workflows - Ad-hoc filtering is useful. Repeatable workflows are scalable. Document your successful filtering strategies and use them monthly.
Conclusion & Next Steps
You now have a complete framework for filtering Google Search Console data. From basic query filters to advanced regex patterns, from simple date comparisons to complex multi-filter segmentation, you're equipped to extract maximum value from GSC.
What you've learned:
- All GSC filter types (query, page, device, country, search appearance) and when to use each
- Date comparison strategies for trend analysis and measuring change impact
- Query filtering for brand analysis, intent segmentation, and content performance
- Page filtering for subdirectory, template, and individual page analysis
- Regular expressions for advanced pattern matching
- Multi-filter combinations for precise segmentation
- Practical workflows for common SEO tasks
Your next steps:
-
Today: Filter your brand vs non-brand queries. See your true organic performance without brand inflation.
-
This week: Set up a month-over-month date comparison (last 28 days vs previous 28 days). Track if your SEO efforts are working.
-
This month: Export filtered data for your blog, products, and resources subdirectories. Compare their performance.
-
Learn one regex pattern: Start with the OR operator (
term1|term2|term3) to filter for multiple terms at once. -
Build your first workflow: Choose one of the five workflows from this guide and run it monthly.
Generic GSC data tells you almost nothing. Filtered GSC data tells you everything. Start filtering today.
Next Step: Apply Your Filtering Skills to Find Opportunities
Now that you've mastered GSC filters, it's time to apply these skills systematically to find your biggest SEO opportunities. Learn how to use the filters you just learned to identify high-impact keywords hiding in positions 5-15 that could double your traffic with focused optimization.
→ Continue your journey: GSC Queries Report: How to Find Your Biggest Opportunities
This next guide shows you exactly which queries to filter for, how to calculate opportunity scores, and the step-by-step framework for turning filtered GSC data into actionable optimization targets.
Related Articles
- The Complete Guide to Google Search Console Analysis - Your comprehensive GSC resource
- Understanding GSC's Data Sampling and Limitations - Learn what GSC doesn't show you and why
- GSC Queries Report: Finding Your Biggest Opportunities - Deep dive into query analysis
- How to Read Your GSC Performance Report - Master the Performance Report basics
- Pages Report Analysis: Identifying Your Best and Worst Performers - Advanced page-level analysis
About the Author: This guide is part of our GSC Mastery series, designed to help you extract maximum value from Google Search Console data for better SEO performance.
Last Updated: January 2026