Evidence-Based SEO: From Data to Action
Turn GSC data into actionable SEO strategy. Learn the prioritization matrix, impact scoring, and systematic frameworks for evidence-based SEO decisions.

From Data to Action: Evidence-Based SEO Decision Making
Your Google Search Console is filled with data. But data isn't strategy—it's numbers on a screen until you turn it into action.
SEO professionals stare at Search Console data and ask: "What should I do with this?"
The gap between analysis and execution kills most SEO strategies. Teams analyze metrics, identify opportunities, then struggle to prioritize. Analysis becomes a substitute for action.
The problem is prioritization. When everything seems important, nothing gets done. With 147 potential improvements, "all of them" isn't an answer.
Indecision costs you. Competitors act while you debate. Every week delaying a high-impression, low-CTR page costs clicks. Every month ignoring declining content loses revenue. Wrong action also costs—three months on redesigns when you should fix title tags represents unrecoverable opportunity cost.
This guide bridges data and action. Learn a systematic framework for turning GSC insights into strategies, a prioritization methodology removing guesswork, and practical approaches for measuring ROI. After diagnosing performance issues, this shows exactly what to do next.
The Data-Driven SEO Philosophy
Following generic advice is like taking someone else's prescription. Evidence-based SEO flips this. Start with what data proves is happening. Use the scientific method: observe, hypothesize, test, measure, iterate. GSC becomes your laboratory, optimizations become experiments.
Why "Best Practices" Aren't Enough
Generic SEO advice suffers from three fundamental problems: 1. Context-blindness: Ignores your situation. "Build backlinks" doesn't help if your problem is 200 pages with 2% CTR instead of 12%. "Improve speed" misses the mark when GSC shows you rank well but lose traffic due to search intent mismatch. 2. Survivorship bias: Published case studies come from edge cases—massive budgets, established brands. DA 85 link building advice won't transfer to DA 23 sites. 3. Changing algorithms: Best practices age poorly. Tactics working last year may be irrelevant today. Your data always reflects current reality. GSC immediately shows update impacts. Don't ignore industry knowledge. Treat best practices as hypotheses to test, not commandments. "Optimize for featured snippets" becomes: "Which pages rank #1-5 for question queries without snippets? What's the traffic gain? Is this our top priority?"
The Evidence-Based SEO Framework
Evidence-based SEO follows a repeatable five-step process:
Step 1: Observe - Use Google Search Console to identify patterns in your performance data. What queries drive impressions but not clicks? Which pages lost traffic recently? Where do you rank position 11-20 with high search volume?
Step 2: Hypothesize - Form a testable hypothesis about why the pattern exists and what might improve it. "This page has low CTR because the title tag doesn't match search intent" or "These queries get high impressions because we rank well, but low clicks because our meta descriptions are generic."
Step 3: Prioritize - Estimate the potential impact (traffic gain × business value) against the effort required (time, resources, dependencies). Not every hypothesis is worth testing right now.
Step 4: Intervene - Implement the change systematically. Document what you changed and when. Make one variable change at a time when possible so you can attribute results correctly.
Step 5: Measure - Track the impact in GSC over an appropriate time window (usually 2-6 weeks). Did the change produce the expected result? If yes, can you apply the same solution to similar pages? If no, what did you learn?
The framework creates feedback loops. Each experiment teaches you about your site, audience, niche. Build institutional knowledge of what works for your context.

Your Data vs Industry Benchmarks: When to Use Each
Never let benchmarks override your data. [VISUAL: Comparison table with two columns - "Traditional SEO Approach" vs "Evidence-Based SEO Approach" showing 8-10 contrasting scenarios] Real GSC Example: Consider two SaaS companies, both in B2B software, both with similar traffic levels. Company A's GSC data shows their problem is low rankings (averaging position 15-25) but decent CTR for their positions. Company B ranks well (averaging position 3-7) but has terrible CTR, well below position benchmarks. The "best practice" might say both should "improve content quality"—but Company A needs backlinks and authority-building while Company B needs better titles and meta descriptions. Same industry, similar metrics on the surface, completely different strategic priorities revealed by drilling into their specific data.
The SEO Prioritization Matrix
Most teams: paralysis, politics, panic. Whoever yells loudest wins. Easiest tasks get done first. Or nothing happens. The SEO Prioritization Matrix solves this. Score tasks on Impact and Effort, plot on a grid, see exactly what to work on first.
The Framework Explained
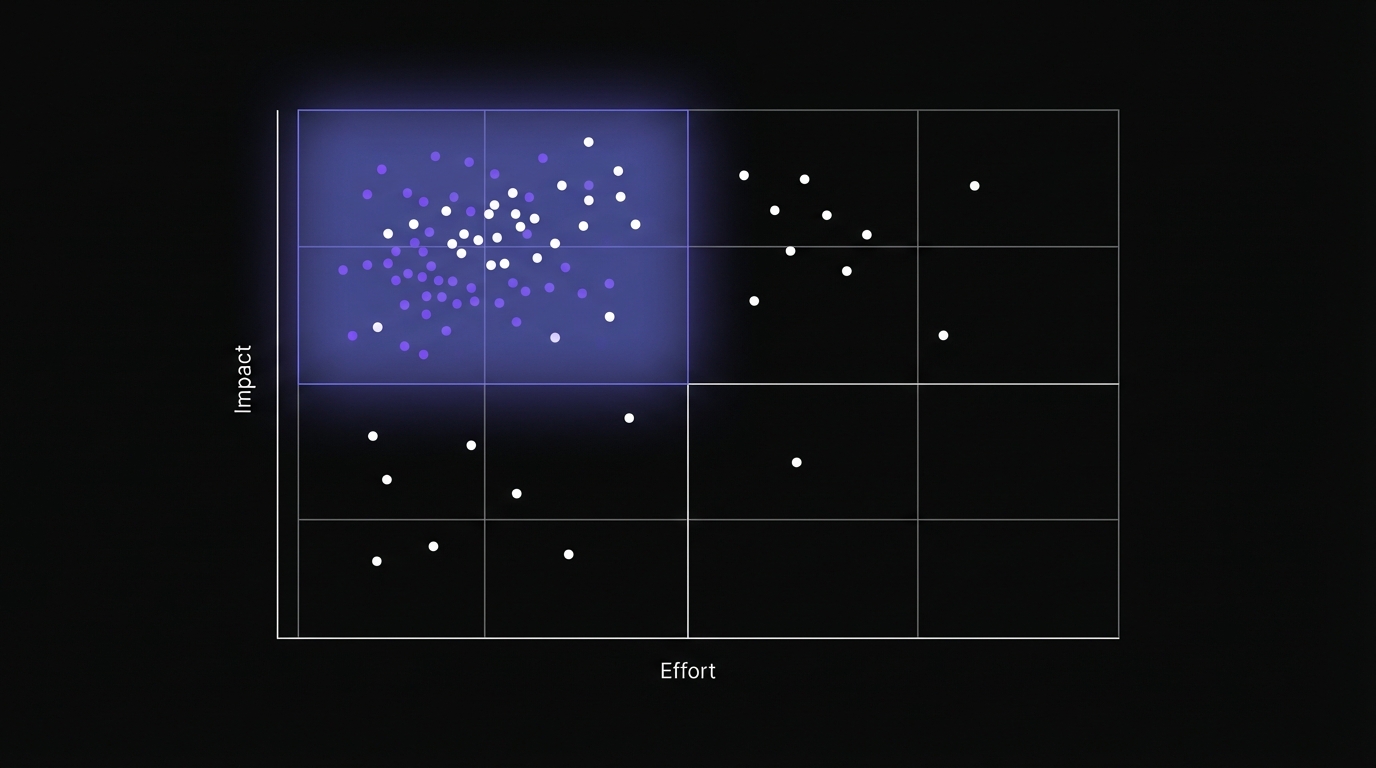
The matrix is beautifully simple: a 2x2 grid with Impact on the Y-axis (low to high) and Effort on the X-axis (low to high). This creates four quadrants, each with a clear action plan:
Quick Wins (High Impact, Low Effort): Do immediately. Best opportunities—meaningful gains, minimal investment. Most teams have 5-15 available.
Major Projects (High Impact, High Effort): Plan carefully. Move the needle significantly but require substantial resources. Schedule into quarterly roadmaps.
Fill-Ins (Low Impact, Low Effort): Batch or delegate. Worth doing but don't consume prime focus. Good for gaps between projects.
Time Wasters (Low Impact, High Effort): Avoid entirely. Poor ROI. Every hour here is an hour not spent on quick wins.
Plot every task using actual scores, not gut feeling. Priorities become obvious. Debate ends because data makes answers clear.
Calculating Impact Scores from GSC Data
Impact = potential value of completing a task. In SEO: How much additional traffic or revenue? GSC provides data to calculate this. Formula: Impact Score = ÷ 100 Use a 1-10 scale where 10 is your highest-priority, biggest-opportunity tasks and 1 is minimal impact. Step 1: Calculate Potential Traffic Gain For different opportunity types, GSC provides the inputs: For low CTR opportunities:
- Find page impressions per month in GSC Performance Report
- Note current CTR and current position
- Look up expected CTR for that position)
- Potential gain = Impressions × Example: Page gets 10,000 impressions at position 3 with 3% CTR. Expected CTR at position 3 is 10%. Potential gain = 10,000 × (0.10 - 0.03) = 700 additional clicks per month. For ranking improvement opportunities:
- Note current position and monthly impressions from Queries report
- Estimate position after optimization
- Calculate impression and CTR changes at new position
- Potential gain = (New impressions × New CTR) - Example: Query at position 14 gets 1,000 impressions, 30 clicks (3% CTR). Moving to position 8 typically gets 1,200 impressions and 8% CTR. Potential gain = (1,200 × 0.08) - 30 = 66 additional clicks per month. For declining content:
- Compare current monthly clicks to peak monthly clicks)
- Potential gain = × recovery rate
- Use 60% as typical recovery rate for content refreshes Example: Page declined from 800 to 300 clicks/month. Potential gain = (800 - 300) × 0.60 = 300 clicks per month recovered. Step 2: Estimate Business Value Not all traffic is equally valuable. A click on a product page for a $5,000/year SaaS plan is worth more than a click on a blog post, which is worth more than a click on your privacy policy. Estimate value by traffic type:
- High-value pages: 3x multiplier
- Medium-value pages: 2x multiplier
- Low-value pages: 1x multiplier Step 3: Calculate Final Impact Score Combine potential traffic gain and business value, then normalize to a 1-10 scale: Example calculations:
- 700 additional clicks on high-value page: (700 × 3) ÷ 100 = Impact Score: 10/10
- 300 recovered clicks on medium-value page: (300 × 2) ÷ 100 = Impact Score: 6/10
- 100 additional clicks on blog post: (100 × 1) ÷ 100 = Impact Score: 1/10 Adjust the divisor (100 in these examples) based on your site's scale. A site with 10,000 monthly clicks total might use 50 as the divisor. A site with 1 million monthly clicks might use 1,000. [VISUAL: Step-by-step annotated screenshots showing how to extract the necessary data from GSC Performance Report and calculate impact scores] Real GSC Example: Let's score a real opportunity. You find a page ranking #3 for a valuable keyword with:
- 8,000 impressions per month
- 2.5% CTR (200 clicks)
- Expected CTR at position 3: 10% Potential traffic gain = 8,000 × (0.10 - 0.025) = 600 clicks/month Business value = High (3x) because it's a product page Impact Score = (600 × 3) ÷ 100 = 18 → Normalize to 10/10 This is a maximum-impact opportunity. Now you need to evaluate effort.
Estimating Effort (Resource Requirements)
Effort = total cost: time, skills, dependencies, opportunity cost. 1-10 scale: 10 = multi-month site migrations, 1 = 15-minute tasks. Effort Dimensions to Consider: Time investment:
- How many hours will this task require?
- Is it one-time work or ongoing maintenance? Skill requirements:
- Can anyone on the team do this, or does it require specialized expertise?
- Do you need to hire externally or learn new skills? Dependencies:
- Does this require other people?
- Do you need approvals or coordination?
- Are there technical dependencies? Typical Effort Estimates by Task Type: | Task Type | Typical Time | Effort Score | Notes | |-----------|-------------|--------------|-------| | Meta description update | 15 min | 1/10 | Can batch multiple pages | | Title tag optimization | 30-45 min | 2/10 | Per page, requires search intent analysis | | Internal linking additions | 1 hour | 2/10 | Finding placement takes most time | | Content refresh (minor) | 2-3 hours | 3/10 | Updating stats, adding 200-300 words | | Content refresh (major) | 6-8 hours | 5/10 | Significant rewrites, new sections | | New content creation | 8-12 hours | 6/10 | Research, writing, optimization | | Template-level optimization | 8 hours + dev | 7/10 | Affects hundreds of pages but needs development | | Technical SEO fixes | 4-40 hours | 5-9/10 | Varies wildly by complexity | | Site migration | 200+ hours | 10/10 | Multi-month project with high risk | Hidden Effort Factors: to account for:
- Approval processes: If you need executive sign-off, add 2-3 points to effort
- Learning curve: First time doing something? Double your time estimate
- Coordination overhead: Every additional person adds communication cost
- Technical debt: Will this task be harder because of existing technical problems? [VISUAL: Decision tree titled "Effort Assessment Questions" that walks through the key questions to determine effort score] Example Effort Scoring: Low effort (1-3/10):
- Optimizing title tags for 10 high-priority pages: 2/10
- Adding internal links to key pages: 2/10 (quick to implement)
- Fixing broken internal links: 1/10 Medium effort (4-6/10):
- Content refresh on 20 declining blog posts: 5/10 (40 hours of work)
- Creating new comparison landing pages: 6/10
- Implementing schema markup on product pages: 5/10 (need developer time) High effort (7-10/10):
- Site architecture restructure: 9/10
- Complete content audit and optimization program: 8/10
- Platform migration (WordPress to headless CMS): 10/10
The Four Quadrants Explained
After scored each task for Impact (1-10) and Effort (1-10), plot them on the matrix. The quadrant boundaries typically fall at the midpoint (5) on each axis. Quick Wins Quadrant (Impact 6-10, Effort 1-4): These are your gold mine. High potential value, low resource investment. The math is simple: if you can generate meaningful traffic gains in a few hours, you do it immediately. Common Quick Win examples from GSC data:
- Title tag optimization for high-impression, low-CTR pages
- Fixing missing meta descriptions on top pages
- Adding 2-3 internal links to strong content
- Optimizing for featured snippets when ranking #1-5
- Consolidating keyword cannibalization Quick Win strategy:
- Identify your top 10 Quick Wins every quarter
- Block time to knock out 2-3 per week
- Measure results after 2-3 weeks
- Share wins with stakeholders to build momentum
- Look for patterns Major Projects Quadrant (Impact 6-10, Effort 5-10): These will move the needle significantly but require serious resources. You can't afford to skip them, but you also can't afford to do them wrong or at the wrong time. Common Major Project examples:
- Site-wide technical SEO overhaul
- Large-scale content creation program (50+ new pages)
- URL structure migration to better information architecture
- Link building campaign for authority building
- Programmatic SEO system for scale Major Project strategy:
- Limit to 1-2 major projects per quarter maximum
- Create detailed project plans with milestones
- Get executive buy-in and resource allocation upfront
- Set clear success metrics and measurement plans
- Don't start Major Projects until Quick Wins are handled Fill-Ins Quadrant (Impact 1-5, Effort 1-4): These tasks are easy but don't move the needle much. They're worth doing—eventually—but should never take priority over Quick Wins or Major Projects. Common Fill-In examples:
- Fixing alt text on blog images
- Updating old dates in footer
- Optimizing pages that get minimal traffic
- Minor technical fixes on low-traffic sections
- Cosmetic improvements to low-performing content Fill-In strategy:
- Batch these together
- Delegate to junior team members as training
- Use as "filler" between major tasks
- Don't let perfect be the enemy of good—do quickly and move on
- Never discuss these in prioritization meetings Time Wasters Quadrant (Impact 1-5, Effort 5-10): These are traps. They'll consume huge resources for minimal return. The hard part is that they often feel important or interesting. Resist. Common Time Waster examples:
- Optimizing pages with <50 monthly impressions
- Redesigning perfectly functional pages for aesthetic reasons only
- Pursuing low-volume vanity keywords
- Over-engineering solutions to edge cases
- Complex technical implementations with marginal SEO benefit Time Waster strategy:
- Explicitly call these out as "not doing this"
- Document why
- Have a clear policy: anything in this quadrant gets declined
- Be especially vigilant for "interesting" projects that are time wasters
- Revisit quarterly [VISUAL: Large prioritization matrix with 15-20 real SEO tasks plotted across all four quadrants, color-coded and labeled]
Common Prioritization Mistakes
Always evaluate impact first. Mistake 2: Only working on Major Projects Some teams ignore Quick Wins entirely, thinking "we need to focus on strategic initiatives." you're passing up dozens of high-ROI opportunities for lower-ROI projects that happen to sound impressive. Mistake 3: Skipping the scoring process "We know what's important" without calculating it. This leads to opinion-driven prioritization, where the loudest voice wins. Force yourself to score every significant task. Mistake 4: Setting too many top priorities "These are all high priority" defeats the purpose of prioritization. You should have 3-5 active Quick Wins and 1-2 active Major Projects at most. Everything else waits. Mistake 5: Never re-prioritizing Your impact and effort estimates will be wrong sometimes. As you complete tasks and get results, your priorities should shift. Re-prioritize quarterly at minimum. Mistake 6: Forgetting to measure If you don't track the actual impact of completed tasks, you can't validate your prioritization model. Did that "Quick Win" drive 300 additional clicks? If not, why? Adjust your scoring approach based on real results. [VISUAL: Checklist titled "Prioritization Red Flags" with 8-10 warning signs of poor prioritization]
Resource Allocation Strategies
Work expands to fill available time. The result: some categories get over-invested (endless content creation) while others get neglected (technical SEO maintenance), with no systematic reasoning behind the imbalance.
The 70-20-10 Resource Allocation Rule
Borrowed from innovation management theory and adapted for SEO, the 70-20-10 rule provides a forcing function for balanced investment: 70% - Core Optimization This is your bread and butter: executing on the prioritized opportunities you've identified in GSC. Title tag optimization, content refreshes, technical fixes, link building—the work that directly addresses known problems with predictable returns. What belongs in the 70%:
- Quick Wins from your prioritization matrix
- Major Projects that are past the planning phase
- Routine maintenance
- Proven tactics that consistently work for your site Why 70%: This ensures you're executing, not just experimenting. Most of your resources should go toward doing the things you know work. 20% - Strategic Experiments This bucket is for learning and growth. Testing new tactics, exploring adjacent opportunities, trying approaches you haven't validated yet. What belongs in the 20%:
- Testing new content formats
- Exploring new keyword territories adjacent to your core
- Trying novel optimization approaches
- Competitive research and strategy development
- Experimenting with AI-driven content or technical SEO automation Why 20%: If you spend 100% on known tactics, you never innovate. The 20% bucket is where tomorrow's Quick Wins are discovered. 10% - Maintenance and Prevention (Keeping the lights on) This is defensive work: monitoring for problems, responding to algorithm updates, fixing breaks, addressing edge cases. What belongs in the 10%:
- Monitoring for traffic drops or technical issues
- Responding to GSC messages
- Fixing broken links and 404 errors
- Monitoring for security issues or site performance degradation
- Keeping plugins/systems up to date Why 10%: This prevents the house from burning down while you're optimizing the kitchen. Not glamorous, but necessary. [VISUAL: Pie chart showing the 70-20-10 split with examples of activities in each segment]
Applying the 70-20-10 Rule
For a team with 40 hours per week of SEO capacity:
- 28 hours on Core Optimization: Execute Quick Wins, advance Major Projects, maintain momentum
- 8 hours on Strategic Experiments: Test new approaches, research opportunities, learn
- 4 hours on Maintenance: Monitor, fix, respond to issues For a solo practitioner with 10 hours per week:
- 7 hours on Core Optimization: Focus on highest-impact opportunities only
- 2 hours on Strategic Experiments: Test one new thing per month
- 1 hour on Maintenance: Weekly health check and issue response The rule is a guideline, not a law. Adjust based on your situation:
- Stable, mature sites: Might shift to 60-25-15
- Crisis mode (major traffic loss): Temporarily shift to 90-5-5)
- New sites building traction: Might go 80-15-5
Monthly Capacity Planning
Resource allocation rules don't matter if you don't allocate resources. Monthly sprint planning turns abstract percentages into concrete commitments. The Monthly Planning Process: Week before month start:
- Review last month's progress and results
- Update prioritization matrix with new data
- Calculate available capacity
- Allocate capacity to 70-20-10 buckets
- Select specific tasks for the month from prioritization matrix
- Assign tasks to team members with deadlines During the month:
- Weekly check-ins on progress (15-30 minutes)
- Adjust if priorities shift dramatically
- Track actual time spent End of month:
- Measure results of completed work
- Update prioritization scores based on actual outcomes
- Document learnings
- Roll incomplete work into next month or re-evaluate priority [VISUAL: Calendar view showing an example monthly sprint schedule with tasks color-coded by 70-20-10 category]
Balancing Reactive vs Proactive Work
One allocation decision often overlooked: how much capacity to reserve for reactive work vs proactive optimization. Reactive work includes:
- Responding to sudden traffic drops
- Fixing technical issues discovered by monitoring
- Addressing stakeholder requests that can't wait
- Responding to algorithm updates that affect your site In an ideal world, you'd be 100% proactive, working through your prioritized list without interruption. In reality, reactive work happens, and if you don't plan for it, it destroys your execution rhythm. The Reserve Capacity Approach: Build in buffer capacity for reactive work:
- Small teams/solo: Reserve 20-30% of capacity for reactive work
- Larger teams: Reserve 15-20% of capacity, handle reactive work in shifts your "40 hours per week" is 30 hours of plannable capacity and 10 hours of reactive buffer. Some weeks you'll use all 10 hours fighting fires. Other weeks you'll use 2 hours and can redirect the rest to proactive work. This prevents the failure mode where your entire planned month gets derailed by a few urgent issues, leaving you with zero completed proactive work and a feeling of constant firefighting. [VISUAL: Table showing "Team Size vs Realistic Output Expectations" with monthly capacity, reserve allocation, and expected deliverables by team size]
When to Outsource vs Build Internal Capacity
As you plan resource allocation, you'll hit capacity constraints. When do you outsource vs hire vs accept current capacity limits? Outsource when:
- One-time specialized work
- Temporary capacity needs
- Skills you won't use regularly
- Areas where you need to move faster than internal training allows Build internal capacity when:
- Core competencies you'll need indefinitely
- Work requiring deep product/industry knowledge
- Tasks with high coordination costs if outsourced
- Strategic work where control and integration matter Accept current limits when:
- ROI of additional capacity doesn't justify cost
- You're not yet executing effectively on current capacity
- Opportunities are limited by factors other than capacity The most common mistake: hiring or outsourcing before you've optimized internal workflows. If you're inefficient at 10 hours per week, you'll be inefficient at 40 hours per week. Fix processes first, scale capacity second.
Building Business Cases for SEO
SEO professionals often struggle with this translation. We speak in rankings, impressions, and CTR. Executives speak in revenue, customers, and competitive positioning. Building effective business cases requires bridging this gap.
From Clicks to Revenue (Attribution Modeling)
The fundamental question executives ask: "How much revenue will this generate?" Google Search Console tells you about clicks, not revenue. But you can build the connection: The Attribution Chain: GSC Clicks → Site Visits → Conversions → Revenue Each link in this chain requires a conversion rate:
- Visit-to-lead conversion rate: What percentage of organic visitors convert to leads?
- Lead-to-customer conversion rate: What percentage of leads become paying customers?
- Average order value (AOV) or Customer Lifetime Value (CLV): How much is each customer worth? Example calculation: Let's say you want to optimize 10 pages with low CTR. Your GSC data shows:
- Combined impressions: 50,000/month
- Current CTR: 3%
- Current clicks: 1,500/month You believe you can improve CTR to 8% (matching position benchmarks):
- Potential clicks: 4,000/month
- Additional clicks: 2,500/month Now apply your conversion funnel:
- Visit-to-lead rate: 5% → 125 additional leads/month
- Lead-to-customer rate: 10% → 12.5 additional customers/month
- Average CLV: $2,000 Monthly revenue impact: $25,000 Annual revenue impact: $300,000 Now you can say: "This title tag optimization project will take 15 hours and could generate $300K in additional annual revenue. The ROI is 20,000%." [VISUAL: Formula graphic showing the attribution chain from GSC clicks through to revenue, with example numbers at each step]
The Challenge of Multi-Touch Attribution
Who gets credit? For business cases, you don't need perfect attribution. You need directionally correct estimates. Use these approaches: First-click attribution for awareness content: If you're working on top-of-funnel blog content, credit organic search with the lead even if they convert later through another channel. This is conservative but defensible. Last-click for bottom-funnel content: If you're optimizing product pages or comparison content, use last-click attribution. If organic search drove the visit that converted, count it. Assisted attribution for middle-funnel: For comprehensive business cases, look at assisted conversions in Google Analytics. How many conversions had organic search in the path, even if it wasn't the last click? The key is being explicit about your attribution model and conservative in your estimates. It's better to say "we'll generate at least $300K" and deliver $400K than to promise $500K and deliver $300K.
Calculating Opportunity Cost of Inaction
Revenue impact is compelling, but opportunity cost can be even more powerful: "What: we're losing by NOT doing this." Opportunity cost calculation: Take your prioritized opportunities and calculate the monthly revenue being left on the table: Example:
- 20 high-impact Quick Wins identified
- Average potential impact per Quick Win: 200 additional clicks/month
- Total potential: 4,000 clicks/month
- Revenue value: $8,000/month "Every month we delay executing these Quick Wins costs us $8,000 in revenue. Over a quarter, that's $24,000. Over a year, $96,000. These are opportunities we've already identified—we need to execute." This framing works especially well when arguing for additional headcount or resources. You're not asking for a cost center—you're asking to stop leaving money on the table. [VISUAL: Example executive dashboard showing opportunity cost accumulating over time, with a "cost of delay" graph]
Presenting SEO ROI to Stakeholders
Different stakeholders care about different things. Tailor your business case to your audience: For CFOs (finance perspective):
- Lead with ROI and payback period
- Show cost of SEO investment vs revenue return
- Compare to other marketing channels
- Emphasize long-term compounding benefits For CMOs (marketing perspective):
- Lead with customer acquisition and market share
- Show share of voice improvements
- Demonstrate brand visibility metrics
- Connect to broader marketing strategy For CEOs (strategic perspective):
- Lead with competitive positioning
- Show market opportunity size
- Emphasize risk mitigation
- Connect to company growth goals For Product Leaders (product perspective):
- Lead with user intent insights from keyword data
- Show which features/products have search demand
- Use GSC data to inform product roadmap
- Demonstrate SEO as a user acquisition channel [VISUAL: Communication matrix showing key messages and metrics by stakeholder type]
The Risk Mitigation Argument
Sometimes the best business case isn't "here's what we'll gain" but "here's what we'll lose if we don't act." Competitive risk framing: "Our main competitor ranks #1 for 40 of our target keywords where we rank #5-10. Based on CTR curves, they're capturing 60% of clicks while we capture 10%. If we lose these positions entirely, we'd lose $200K in annual organic revenue. This optimization project defends that revenue and positions us to compete for their traffic." Technical debt risk framing: "Our current site architecture creates crawl inefficiency and prevents Google from properly indexing our content. As we add more pages, this problem compounds. We've already seen 5 pages drop out of the index last quarter. If this continues, we risk losing 20% of our organic traffic over the next year ($500K revenue impact). The migration project addresses the root cause." Algorithm update risk framing: "Google's recent helpful content update targeted sites with thin, AI-generated content. we haven't been hit yet but 15% of our pages fit the risk profile. Our competitors who had similar content lost 40% of their traffic. Proactively refreshing these pages protects against future algorithmic risk." Risk mitigation resonates with risk-averse executives who might not be motivated by growth opportunities but are motivated to prevent losses. [VISUAL: Before/after comparison showing technical metrics (rankings, impressions) translated to business metrics]
Creating Executive-Friendly Presentations
When presenting business cases, format matters: The One-Page Business Case: Executives are busy. Can you make your case in one page? Structure:
- The Opportunity (2-3 sentences): What we want to do
- The Business Impact (3-4 bullets): Revenue, customers, competitive positioning
- The Investment (1-2 bullets): Hours, budget, timeline
- The ROI (1 number): "20x ROI" or "$300K net revenue"
- The Ask (1 sentence): What you need to proceed The Slide Deck Business Case: If you need more detail:
- Slide 1: Executive summary (the one-pager)
- Slide 2: Current state and problem
- Slide 3: Opportunity size
- Slide 4: Proposed solution
- Slide 5: Expected outcomes
- Slide 6: Investment required
- Slide 7: Timeline and milestones
- Slide 8: Risks and mitigation
- Slide 9: Next steps and decision needed Keep it visual. Use charts from GSC showing the problem. Show before/after projections. Use competitive analysis to demonstrate market opportunity. Real GSC Example: A B2B SaaS company needed executive approval for a major content refresh project. Their business case:
- Current state: 50 blog posts declining 30% average over 6 months
- Traffic loss: 8,000 clicks/month lost
- Revenue impact: $16,000/month lost
- Proposed solution: Systematic content refresh
- Investment: 150 hours spread over 10 weeks
- Expected outcome: Recover 70% of lost traffic
- ROI: $134,400 annual revenue from 150 hours of work The CFO approved immediately because the math was clear and the risk was low.
Stakeholder Communication & Alignment
You need developers to implement technical changes, but dev teams have their own roadmaps. You need executive support, but executives don't care about your rankings. You need content teams to follow SEO guidelines, but they prioritize creative freedom. Effective stakeholder communication bridges these gaps.
Tailoring Communication by Audience
Different stakeholders need different information, delivered in different formats, at different frequencies. Technical Teams (Developers, Engineers): What they care about: Clear specifications, minimal technical debt, understanding "why" not just "what" How to communicate:
- Written tickets with specific acceptance criteria
- Technical documentation (not SEO jargon)
- Impact on site performance and user experience
- Why this matters (not just "for SEO")
*This prevents wasted crawl budget and consolidates ranking signals. Spec: Add
<link rel="canonical" href="[base-page-url]">to<head>on all paginated pages where?page=>1." Creative Teams (Content Writers, Designers): What they care about: Maintaining quality and creativity, understanding the user benefit, clear guidelines without micromanagement How to communicate: - Style guides and checklists (not lectures)
- Examples of good execution
- Explaining user intent
- Collaborative approach *Can we Ensure we answer them clearly? Here are the specific queries where we're getting impressions but users aren't clicking—our titles probably don't match what they're looking for." Executive Stakeholders (C-suite, VPs): What they care about: Business impact, competitive positioning, ROI, risk, strategic alignment How to communicate:
- Bottom-line first
- Monthly scorecards
- Exception reporting
- Strategic framing *Key wins: Captured #1 ranking from Competitor X for our top product category, now driving 800 clicks/month. Next quarter focus: Similar approach for second product category." Product Teams: What they care about: User needs, product strategy, roadmap priorities, user research insights How to communicate:
- Search demand as user research
- GSC data showing which features have market demand
- Competitive analysis showing what users are comparing
- SEO as a user acquisition and retention strategy *Users are clearly trying to evaluate these options. A comparison page would serve users and capture this traffic—could we add to product marketing roadmap?" [VISUAL: Table showing communication format, frequency, and key messages by stakeholder type]
Setting and Managing Expectations
SEO's biggest communication challenge: managing timeline expectations. SEO changes don't show immediate results like paid ads. This creates frustration if not addressed upfront. The Expectations-Setting Conversation: Have this conversation before starting work: "Here's our realistic timeline for seeing results:
- Technical fixes: 2-4 weeks after implementation and indexing
- Content optimization: 2-6 weeks depending on crawl frequency
- New content: 4-12 weeks depending on competition and authority
- Link building: 8-16 weeks for authority to build and impact rankings
- Major projects: 3-6 months for full impact We'll track leading indicators (impressions, rankings) weekly, but traffic and conversion impact takes longer. I'll send monthly updates showing progress, but don't expect to see the full impact until [specific timeframe]." Document this in writing. When someone asks two weeks later "why haven't we seen results yet," you can reference the documented timeline. The Monthly Update Format: Consistent reporting prevents "what are you doing?" questions:
- This Month's Focus
- Results
- Learnings
- Next Month's Plan (what you'll focus on next) Keep it to one page. Use visuals (charts from GSC). Highlight wins. Be honest about failures (but frame them as learnings). [VISUAL: Example monthly update email template with sections labeled]
Handling the "How Long Until We Rank #1?" Question
Every SEO gets this question. The honest answer: "It depends on 50 variables, many outside our control, and ranking #1 might not even be the right goal." But that answer doesn't satisfy stakeholders. Here's a better approach: Reframe the question: "Ranking #1 is the metric, but what's the business goal? More traffic? More customers? If we increase traffic by 50% but never hit #1, is that success?" Usually the answer is yes. This shifts the conversation from an uncontrollable metric (rankings) to controllable outcomes (traffic, leads, revenue). Provide a roadmap, not a timeline: "Here's the progression we typically see:
- Months 1-2: Technical foundation and quick wins
- Months 3-4: Content optimization at scale
- Months 5-6: Strategic initiatives show impact (major ranking improvements)
- Months 7-12: Compounding effects, authority building Rankings improve throughout this process. Whether we hit #1 depends on how competitive the keywords are and what competitors do. What I can control is consistent progress. If we're not seeing improvement after 3 months, we pivot strategy." Show the competition: Pull up the SERP. "Here are the sites currently ranking #1-5. They have domain authorities of 75, 68, 70, 72. We're at 45. Ranking #1 against these competitors requires building substantially more authority over 6-12 months. But ranking #5-8 is achievable in 3-4 months, which would drive 70% of the traffic that #1 gets." This grounds the conversation in reality and manages expectations without saying "it's impossible."
Building Cross-Functional Buy-In
Create:
- Clear documentation
- Specific tickets with acceptance criteria
- Prioritization
- Respect for their constraints 2. Speaking their language Don't ask developers to "improve SEO." Ask them to "reduce page load time to improve user experience and search rankings." Same outcome, framed in terms they care about. 3. Demonstrating value consistently When your recommendations drive results, share credit with the teams who helped. When the dev team implements technical improvements and traffic increases, Ensure their managers know they contributed to a revenue win. 4. Being a collaborative partner, not a blocker The worst reputation: the SEO person who says "no" to everything creative because "it's not SEO optimized." Instead: "Here's how we can achieve your creative vision AND maintain SEO value." 5. Creating shared success metrics If developers are measured on feature velocity, showing how SEO work drives user acquisition helps align incentives. If content teams are measured on engagement, showing how SEO-optimized content performs better creates natural alignment.
Celebrating Wins (and Learning from Losses)
Stakeholder communication isn't about reporting problems and asking for resources. It's about creating momentum through visible wins. Win-sharing framework: When something succeeds:
- Document the win (before/after data from GSC)
- Calculate business impact (clicks → revenue)
- Explain what drove it
- Share credit with anyone who contributed
- Identify patterns
- Celebrate publicly **Results: 45% average CTR increase, 1,200 additional clicks/month, estimated $4,800 additional monthly revenue. Thanks to [Content Manager] for writing the new titles and [Dev] for implementing quickly. We'll apply the same approach to 20 more pages next month." This accomplishes multiple goals: demonstrates ROI, shares credit, builds momentum, sets expectations for continued results. Learning-from-losses framework: When something fails or disappoints:
- Acknowledge it directly (don't hide or spin)
- Explain what you expected and what happened
- Analyze why
- Extract the learning (what will you do differently?)
- Pivot (here's the adjusted plan) Example: "We expected the content refresh on 10 blog posts to recover 60% of lost traffic within 4 weeks." This maintains credibility and demonstrates that you're learning and adapting, not blindly following a playbook.
Measuring Success and ROI
"We're working hard on SEO" isn't a success metric. Neither is "rankings improved" or "traffic went up." Success means achieving specific, measurable business outcomes that you defined in advance. Measuring SEO success requires three things: defining the right metrics upfront, implementing proper tracking and attribution, and creating feedback loops that connect actions to outcomes.
Core SEO KPIs to Track
Not all metrics matter equally. Focus on KPIs that connect to business outcomes and are actionable. Tier 1 KPIs (Business Outcomes): These are the metrics that matter to executives and directly tie to revenue:
- Organic Revenue - Total revenue attributed to organic search traffic
- Organic Leads/Customers - New leads or customers from organic search
- Customer Acquisition Cost (CAC) - Cost of SEO investment ÷ customers acquired
- Market Share (Share of Voice) - Your visibility vs competitors for target keywords How to track: Google Analytics 4 with proper attribution, CRM integration for lead-to-customer tracking Report on: Monthly trends, year-over-year growth, comparison to other channels Tier 2 KPIs (Engagement Metrics): These indicate whether your traffic is high-quality and engaged:
- Organic Traffic - Total clicks from organic search
- Traffic by Page Type - Product pages vs blog vs other (quality matters)
- Engagement Metrics - Pages per session, time on site, scroll depth for organic visitors
- Conversion Rate - Percentage of organic visitors who convert How to track: Google Analytics 4, segmented by organic search traffic source Report on: Monthly, with context Tier 3 KPIs (SEO Health Metrics): These are diagnostic—they indicate SEO health but don't directly correlate to business outcomes:
- Impressions (from GSC) - Search visibility
- Average CTR - Effectiveness of titles/descriptions
- Average Position - Ranking performance
- Indexed Pages - Technical health
- Core Web Vitals - User experience metrics How to track: Google Search Console, GSC API for scaled tracking Report on: Weekly monitoring, monthly trends, exception reporting (flag major changes) Tier 4 KPIs: These feel good but don't directly matter:
- Domain Authority - Directionally useful, but not a goal
- Backlink Count - Quality matters more than quantity
- Keyword Rankings - Output metric, not outcome Use these for: Internal monitoring, diagnosis, competitive research—but don't make them primary KPIs The KPI Hierarchy: Report Tier 1 and 2 to executives. Track Tier 3 for operational management. Use Tier 4 for diagnosis only. Never lead with vanity metrics—always connect to business outcomes. [VISUAL: Dashboard mockup showing the KPI hierarchy with example metrics and visualization types for each tier]
Leading vs Lagging Indicators
SEO changes take time to show business impact. Leading indicators help you know if you're on track before lagging indicators (revenue) change. Leading Indicators (Signal Early Success): These change quickly after optimizations:
- Impressions increase - Your pages are showing up more in search results (days to weeks)
- Average position improvement - Rankings are improving (weeks)
- CTR improvement - Your optimizations are working (weeks)
- Indexed pages increase - Google is crawling and indexing your content (days to weeks) Why they matter: If these don't improve after optimizations, your lagging indicators (traffic, revenue) won't either. They're early warning signals. Lagging Indicators (Measure Ultimate Success): These change slowly but matter most:
- Organic traffic - Takes weeks to months after rankings improve
- Organic conversions - Takes longer as you need traffic and conversion
- Revenue - Takes longest, especially in long sales cycles
- Market share - Reflects sustained competitive performance Why they matter: These are the actual business outcomes. Leading indicators predict them, but lagging indicators prove success. Using Both in Communication: "Early signals are positive: Impressions up 30% and average position improved from 18 to 12 for our target keyword cluster. This typically leads to 20-30% traffic increases within 4-6 weeks. We'll track conversion impact over the next 8 weeks." This manages expectations (results aren't instant) while demonstrating that your actions are working (leading indicators prove it). [VISUAL: Chart showing leading indicators (impressions, position) changing weeks before lagging indicators (clicks, conversions) with timeline annotations]
Attribution: Connecting SEO to Revenue
Yet you need to attribute revenue to SEO to prove ROI. Here are practical attribution approaches: Approach 1: First-Click Attribution for Top-Funnel Content For awareness content, credit organic search with leads/customers where it was the first touch. Pros: Recognizes SEO's role in top-of-funnel acquisition Cons: May over-credit SEO and under-credit closing channels Best for: Content-heavy strategies, long sales cycles Approach 2: Last-Click Attribution for Bottom-Funnel Content For transactional content, credit organic search with conversions where it was the last touch before conversion. Pros: Directly ties SEO to conversions Cons: Ignores SEO's role in earlier discovery Best for: E-commerce, short sales cycles, bottom-funnel focus Approach 3: Multi-Touch Attribution Credit all channels in the conversion path proportionally. If a user visits via organic search, returns via email, and converts via paid search, each channel gets partial credit. Pros: Most accurate representation of reality Cons: Complex to implement and explain Best for: Sophisticated marketing teams with proper analytics setup Approach 4: Assisted Conversion Tracking Track how often organic search appears anywhere in the conversion path, even if it's not first or last click. Pros: Shows SEO's role without over-claiming Cons: Doesn't directly attribute revenue (more of a supporting metric) Best for: Demonstrating SEO's contribution in multi-channel marketing Practical recommendation: Use last-click attribution for simplicity and conservative estimates. Supplement with assisted conversion data to show SEO's broader role. Document your approach explicitly so stakeholders understand what you're measuring. [VISUAL: Diagram showing a multi-touch customer journey with different attribution models applied and resulting credit distribution]
Long-term vs Short-term Metrics
SEO requires balancing quick wins (short-term results) with strategic initiatives (long-term value). Your measurement approach should reflect both. Short-term Metrics (Weeks to Months): Track these for Quick Wins and tactical optimizations:
- CTR improvements from title/meta optimization
- Traffic recovery from content refreshes
- Rankings gains for position 11-20 keywords
- Technical issue resolution Report on: Weekly or monthly Use for: Demonstrating momentum, validating tactics, showing early wins Long-term Metrics (Quarters to Years): Track these for strategic initiatives and overall program health:
- Year-over-year organic traffic and revenue growth
- Market share gains in core keyword categories
- Domain authority and backlink profile growth
- Organic percentage of total revenue Report on: Quarterly or annually Use for: Strategic planning, program ROI, executive reporting The Balance: Quick wins maintain momentum and stakeholder confidence. Strategic initiatives build compounding value. You need both. Example framing: "This quarter we executed 15 Quick Wins generating $45K in additional revenue. We also completed Phase 1 of our site architecture improvement, which won't show full impact until next quarter but will unlock 2-3x our current optimization capacity. Short-term wins fund long-term growth." [VISUAL: Timeline showing realistic expectations by tactic type - Quick Wins (2-4 weeks), Content Optimization (4-8 weeks), Technical Projects (8-16 weeks), Authority Building (12+ weeks)]
When to Pivot vs Persist
Not every SEO initiative works as expected. How do you know when to keep going and when to change strategy? Persist when:
- Leading indicators are positive - If impressions and position are improving but traffic hasn't increased yet, give it time
- Timeline is still reasonable - If you're 4 weeks into an expected 8-week timeline, don't panic yet
- Hypothesis remains valid - If market conditions haven't changed dramatically
- Incremental progress is visible - Even if results are slower than expected, steady improvement suggests you're on the right track Pivot when:
- Leading indicators are negative or flat - If impressions and position aren't improving after 4-6 weeks, your approach isn't working
- Hypothesis was disproven - GSC data shows your assumption was wrong
- External factors changed - Algorithm update, competitive change, market shift
- Opportunity cost is too high - Even if this might eventually work, better opportunities have emerged Example - Persist: You optimized 20 pages for featured snippets. After 3 weeks, impressions are up 40% but clicks only up 10%. Diagnosis: Google is showing your pages more but you haven't won the featured snippets yet. Decision: Persist—adjust formatting to better match featured snippet requirements. Example - Pivot: You invested in link building for 4 months. Backlinks increased but rankings didn't improve. Analysis: GSC shows your actual problem is search intent mismatch. Decision: Pivot—pause link building, focus on content optimization for better intent match. [VISUAL: Decision flowchart titled "Persist or Pivot?" walking through key diagnostic questions]
Proving Incremental Value
One challenge in SEO ROI: how do you prove your work caused the improvement vs other factors? Approach 1: Before/After with Specific Attribution For discrete optimizations, compare specific metrics before and after: Example: "We optimized title tags on 15 product pages on May 1st. These pages' CTR was 3.2% in April (GSC data) and 5.8% in June (GSC data). This equals 1,200 additional clicks per month on these 15 pages." Approach 2: Control Groups When optimizing at scale, create control groups: Example: "We refreshed content on 30 of our 60 declining blog posts. The refreshed posts recovered 65% of lost traffic. The non-refreshed posts continued declining. This proves the intervention caused the recovery." Approach 3: Correlation with Implementation Dates When you can't create controls, look for clear correlation: Example: "We implemented site-wide technical improvements on June 15th. Overall organic traffic was flat February-June, then increased 25% July-September. GSC shows improved indexing and average position gains starting mid-June. we can't isolate causation completely but the timing strongly suggests our technical work drove the improvement." Approach 4: Segmentation Analysis Compare performance of pages you optimized vs pages you didn't: Example: "Category pages we optimized for internal linking gained 35% traffic. Category pages we didn't touch gained 5% traffic (general market growth). This suggests our optimization added ~30% incremental value." The goal isn't perfect attribution—it's providing reasonable evidence that your work created value. Be transparent about your attribution approach and conservative in your claims.
Agile SEO Methodologies
Instead of rigid long-term plans, you work in short cycles (sprints), test hypotheses, measure results, and continuously adapt based on what you learn.
SEO Sprints (2-Week Cycles)
An SEO sprint is a focused, time-boxed period (typically 2 weeks) where you commit to completing specific tasks and measuring results. The Sprint Structure: Week 0:
- Review previous sprint results
- Update prioritization matrix with new GSC data
- Select tasks for next sprint from the Quick Wins quadrant
- Assign tasks to team members
- Set clear success metrics for each task Weeks 1-2 (Execution):
- Daily stand-ups (15 minutes): What did you do yesterday? What will you do today? Any blockers?
- Execute assigned tasks
- Track time and effort for better future estimation
- Document changes and implementation dates End of Sprint:
- Review: Did we complete the committed tasks? What results did we see (in GSC or analytics)?
- Retrospective: What went well? What could improve? What did we learn?
- Planning: What's next? Sprint Cadence: 2-week sprints create urgency without stress. They're long enough to complete meaningful work and measure initial results, but short enough to adapt quickly when something isn't working. Example sprint commitment:
- Optimize title tags for 12 high-impression, low-CTR pages
- Refresh content on 3 declining blog posts
- Fix technical crawl errors on 8 pages
- Implement internal linking improvements to 5 key pages Expected outcomes:
- 30% average CTR improvement on optimized titles
- 50% traffic recovery on refreshed posts
- Technical errors resolved [VISUAL: Diagram showing the 2-week sprint cycle with planning, daily stand-ups, execution, review, and retrospective phases]
Hypothesis-Driven Testing
Agile SEO means treating every optimization as an experiment. You start with a hypothesis, test it, and learn from the results regardless of whether it succeeds or fails. The Hypothesis Format: "We believe that [change] will result in [outcome] for [audience], which we will measure using [metric]." Example hypotheses:
- "We believe that adding FAQ schema markup to our product pages will result in featured snippet wins for question queries, which we will measure using position tracking and CTR changes in GSC."
- "We believe that consolidating our 3 similar pages about [topic] into one comprehensive page will result in better rankings and more traffic, which we will measure using page-level impression and click data in GSC."
- "We believe that improving internal linking to our category pages from related blog content will result in ranking improvements, which we will measure using average position for target keywords." Why Hypothesis-Driven Testing Matters:
- Forces clear thinking - You have to articulate what you expect to happen and why
- Enables learning - If results differ from hypothesis, you learn something about your site/audience
- Prevents random tactics - Every action has a strategic purpose
- Makes measurement obvious - The hypothesis tells you exactly what to measure Documenting Experiments: Keep a simple experiment log: | Experiment | Hypothesis | Implementation Date | Expected Timeline | Actual Result | Learning | |------------|------------|-------------------|------------------|---------------|----------| | Title tag optimization - Product pages | High impressions + low CTR suggests poor titles. Optimizing will increase CTR by 30%+ | May 15 | 2-3 weeks | CTR improved 45% average (June 5 data) | Title optimization is high-impact Quick Win. Prioritize more. | | Internal linking to blog content | Weak internal links to blog posts. Adding 3-5 contextual links will improve rankings | May 20 | 4-6 weeks | No measurable impact after 6 weeks | Blog posts may need backlinks, not internal links. Pivot to external link building. | This log becomes institutional knowledge. New team members can see what's been tested and what worked. You avoid repeating failed experiments. [VISUAL: Hypothesis documentation template showing all key fields to capture]
The Build-Measure-Learn Loop
Agile SEO follows a continuous improvement cycle borrowed from Lean Startup methodology: Build: Implement the optimization Measure: Track the impact using GSC and analytics Learn: Analyze results and extract insights Loop back to Build: Use learnings to inform the next sprint This loop happens every sprint. You're constantly learning about what works for your specific site and compounding that knowledge. Example Loop: Sprint 1 - Build: Optimize meta descriptions for top 20 pages with low CTR Sprint 1 - Measure: After 3 weeks, GSC shows CTR improved 12% average—less than expected (hoped for 25%) Sprint 1 - Learn: Analysis shows pages with question-format meta descriptions improved 30%, but generic descriptions only improved 5%. Insight: Question formats work better for our audience. Sprint 2 - Build: Re-optimize the underperforming pages with question-format meta descriptions Sprint 2 - Measure: CTR improved additional 20% on re-optimized pages Sprint 2 - Learn: Question formats are consistently effective. Add to playbook. Test on new pages. Without the loop, you'd have optimized meta descriptions once, seen mediocre results, and moved on. With the loop, you dug deeper, found what works, and compounded the learning. [VISUAL: Circular diagram showing Build → Measure → Learn → Build with example tasks at each stage]
Building a Culture of Experimentation
Agile SEO requires organizational buy-in for experimentation. accepting that some experiments will fail—and that's valuable because failures teach you what doesn't work. Cultural Shifts Needed: From: Perfectionism → To: Iteration Agile SEO doesn't wait for the perfect plan. You execute with 80% confidence, measure quickly, and iterate. Perfect plans take too long and are usually wrong anyway. From: Blame for Failures → To: Learning from Failures If you optimize 10 pages and only 6 improve, that's not a failure—it's data. Why did 4 not improve? What's different about them? The learning is valuable. From: Annual Planning → To: Quarterly/Monthly Planning You still have long-term strategy, but you adapt quarterly based on results. Rigid annual plans ignore what you learn along the way. From: Siloed Execution → To: Cross-Functional Collaboration Agile works best when SEO, dev, content, and product teams collaborate in sprints. Daily stand-ups and sprint reviews keep everyone aligned. How to Build This Culture:
- Start small - Run one pilot sprint with a small team. Demonstrate results. Expand from there.
- Celebrate learning - When experiments fail, explicitly share what you learned. Make failure psychologically safe.
- Show velocity - Track completed tasks per sprint. Demonstrate that agile faster execution.
- Involve stakeholders - Invite executives to sprint reviews. Show rapid progress and measurement. [VISUAL: Example sprint board (Kanban-style) showing To Do, In Progress, In Review, Done columns with task cards]
Scaling What Works, Killing What Doesn't
The final piece of agile SEO: systematic scaling of successes and ruthless elimination of ineffective tactics. When Something Works:
- Document exactly what you did - Create a playbook entry
- Calculate ROI - Time invested vs traffic/revenue gained
- Find similar opportunities - Use GSC to identify other pages/queries with the same pattern
- Scale the approach - Apply the same tactic to 10x or 100x more pages
- Automate if possible - Can this be templated or automated? Example: Title tag optimization generated 45% CTR improvement on 10 pages. Find 50 more pages with the same pattern (high impressions, low CTR). Create a title optimization framework. Train content team to apply it. Scale from 10 pages to 200 pages over next quarter. When Something Doesn't Work:
- Analyze why - Was the hypothesis wrong? Execution flawed? Wrong timing?
- Extract the learning - What does this tell you about your site/audience?
- Decide: Pivot or kill - Can you modify the approach, or should you stop entirely?
- Reallocate resources - Move time from failed tactic to proven winners Example: Link building campaign generated 50 new backlinks but no ranking improvements after 4 months. Analysis: GSC shows the actual problem is poor content quality and search intent mismatch, not authority. Learning: Fix content before building links. Decision: Kill the link building campaign for now, reallocate budget to content improvement. The agile mindset: You're not committed to any specific tactic. You're committed to continuous learning and systematic improvement. Double down on what works. Ruthlessly cut what doesn't.
Scaling Optimization Efforts
You could spend the next year optimizing them one by one—or you could find patterns and optimize them at scale. Scaling optimization is about working smarter, not just harder. It's the difference between fixing 10 pages individually and fixing 1,000 pages with a template change. Between manually optimizing 50 meta descriptions and creating a system that generates effective descriptions programmatically.
Pattern Recognition in GSC Data
The first step in scaling optimization is identifying patterns. Instead of looking at individual pages, look for groups of pages with similar characteristics and similar problems. Common Patterns in GSC Data: Pattern 1: Template-Level Problems Signal: All pages using the same template show similar underperformance Example: All 500 product pages have 3% CTR when they should have 8%. Analysis reveals they all use the same title tag template: "[Product Name] - [Company Name]". The template is the problem, not individual pages. Scale Solution: Fix the template once. Adjust to: "[Product Name]: [Key Benefit] - [Company Name]". One change fixes 500 pages. Pattern 2: Content Type Problems Signal: All pages of a certain type share the same issue Example: All blog posts average position 15-20 for target keywords. Analysis: They're all 800-1,200 words while ranking competitors average 2,500-3,500 words. Scale Solution: Create a systematic content expansion process. Identify the 50 highest-potential posts (highest impressions), expand them to 2,500+ words with comprehensive sections, measure results, then scale to remaining posts. Pattern 3: Query Type Problems Signal: Similar queries across many pages show the same underperformance Example: All "how to" queries get high impressions but low clicks. Analysis: None of your pages have featured snippet optimization, so competitors always hold position 0. Scale Solution: Implement featured snippet optimization across all "how to" content. Create a template: H2 question, 50-word answer paragraph, detailed expansion below. Pattern 4: Time-Based Problems Signal: All pages from a certain time period show similar issues Example: All content published in 2020-2021 is declining. Content published 2023-2024 is stable or growing. Analysis: Older content has outdated information and examples. Scale Solution: Systematic content refresh program prioritized by traffic potential. Tackle highest-traffic pages first, update statistics/examples, add new sections, refresh publish dates. How to Find Patterns: Use GSC filters and sorting:
- Filter by URL pattern - Filter for
/product/to see all product pages together - Sort by CTR - Are all low-CTR pages using the same template?
- Compare page types - Export data, tag by page type in spreadsheet, compare averages
- Date comparison - Look for patterns in when pages were published vs how they perform
- Query analysis - Filter queries by keyword patterns [VISUAL: GSC screenshot showing filtered results highlighting a pattern across page groups] Real GSC Example: A SaaS company analyzed 300 pages in GSC. Individually, the data looked random. But filtering by URL pattern revealed:
/features/pages: 8% average CTR (good)/blog/pages: 4% average CTR (below benchmark)/help/pages: 2% average CTR (terrible) All/help/pages shared the same title format: "Help: [Topic]". The word "Help" in titles signaled low-quality content to users. Changing the template to "[Topic] - Step-by-Step Guide" increased average CTR to 5.5%. One template change improved 100 pages instantly.
Template-Level Optimization Strategy
Template-level optimization is the highest-leverage scaling approach. Change the template once, improve thousands of pages. When Template Optimization Makes Sense:
- You have hundreds of pages using the same template
- GSC data shows these pages underperform similarly
- The fix can be applied at template level
- You have development resources to modify templates
Common Template Optimizations:
1. Title Tag Templates
Before:
[Product Name] - Company NameProblem: No differentiation, no value proposition, company name takes valuable characters After:[Product Name]: [Primary Benefit] | CategoryResult: Descriptive, includes keywords, shows value proposition 2. Meta Description Templates Before: Auto-generated first 155 characters of body copy (usually poor) Problem: Generic, doesn't match search intent, no call-to-action After: Template with dynamic fields:[Product Name] [primary benefit]. [Key feature 1], [key feature 2], and [key feature 3]. [CTA]Result: Structured, benefit-focused, actionable 3. Header Structure Templates Before: No consistent H2/H3 structure, headers don't match search intent Problem: Poor scannability, doesn't answer user questions After: Standardized sections: Overview, Key Features, How It Works, Pricing, FAQ Result: Matches user intent, improves engagement, targets featured snippets 4. Internal Linking Templates Before: No systematic internal linking Problem: Weaker pages don't receive authority from stronger pages After: Automated contextual links: category pages link to products, products link to related products, blog posts link to relevant category pages Result: Better PageRank distribution, improved rankings Template Optimization Process:
- Identify the pattern - Use GSC to find pages with shared problems
- Test on a sample - Optimize 10-20 pages manually first, measure results
- If successful, scale to template - Work with developers to implement at template level
- Monitor results - Track GSC metrics for all affected pages over 4-6 weeks
- Iterate if needed - If results are mixed, analyze why and adjust template [VISUAL: Decision flowchart titled "Should I optimize this page individually or as part of a template?" with decision points about scale, similarity, and resources]
Automation vs Manual Optimization
Not everything can or should be automated. Understanding when to automate vs manually optimize is key to efficient scaling. Automate When:
- You're applying the same change to 100+ pages
- The change follows clear rules (if X, then Y)
- Quality loss from automation is minimal
- Manual work would take prohibitive time Manual Optimize When:
- Pages are unique and high-value
- Nuance and creativity matter
- You're testing new approaches
- Errors would be costly
Automation Opportunities in SEO:
1. Programmatic Meta Descriptions
For large e-commerce sites or content databases, generate meta descriptions from structured data:
Template:
"Shop [Product Name] at [Brand]. [Category] with [Key Feature 1] and [Key Feature 2]. [Rating] stars. Free shipping on orders over $50."When it works: Product pages with structured data When it doesn't: Unique content where generic templates sound robotic 2. Programmatic Internal Linking Automatically link related content based on rules: Rule examples: - Product pages link to their category page
- Blog posts link to relevant product pages when mentioning features
- Category pages link to top-performing products in that category When it works: Clear hierarchical or topical relationships When it doesn't: When context-specific manual curation matters more 3. Automated Content Updates For content with structured data that changes (statistics, pricing, dates): Example: Articles with statistics auto-update when source data updates When it works: Data-driven content where freshness matters When it doesn't: Narrative content where dates/stats are illustrative, not central 4. Bulk Technical SEO Fixes Technical issues that follow rules can be automated: Examples:
- Add canonical tags to all paginated pages
- Implement schema markup across templates
- Set up automatic XML sitemap generation
- Fix broken internal links programmatically The Hybrid Approach: Often the best answer is automation + manual review:
- Use automation to generate first drafts
- Manually review and refine the top 20%
- Let automation handle the remaining 80% This balances efficiency (automation) with quality.
Leveraging Tools and Systems for Scale
Scaling optimization requires the right tools. Manual work in GSC doesn't scale beyond a few dozen pages. Essential Tools for Scaling: GSC API and Data Export:
- Export GSC data to spreadsheets for bulk analysis
- Use GSC API for automated reporting and monitoring
- Create dashboards that surface patterns across thousands of pages Screaming Frog or Sitebulb:
- Crawl entire site to identify technical issues at scale
- Find missing title tags, meta descriptions, header issues
- Bulk export for analysis and prioritization Content Management Systems with SEO Features:
- Template-level control over title tags and meta descriptions
- Bulk editing capabilities
- Automated internal linking features Spreadsheet Analysis:
- Export GSC data, tag pages by type, analyze patterns
- Calculate impact scores for hundreds of opportunities
- Prioritize and batch similar optimizations Custom Scripts (if technical):
- Python scripts to analyze GSC API data
- Automated opportunity identification
- Bulk operations via CMS APIs Example Scaling Workflow:
- Export GSC data for all pages (past 3 months)
- Tag pages by type (product, blog, category, etc.) in spreadsheet
- Calculate metrics
- Identify patterns
- Test manual optimization on 10 sample pages
- Measure results after 3 weeks
- Scale successful approach to remaining pages via template changes or bulk edits
- Monitor in GSC to verify impact across all pages This workflow takes 500 potential individual optimizations and converts them into one scalable intervention. [VISUAL: Example spreadsheet showing GSC data with additional columns for page type, actual vs expected CTR, opportunity score, and priority]
Building Sustainable SEO Systems
You build a title tag template and review process that ensures every new page launches with optimized titles (system). Tactics produce one-time wins. Systems produce compounding results.
Essential SEO Processes to Document
If you left your company tomorrow, would SEO fall apart? Or would documented processes enable someone else to continue the work effectively? Core Processes to Document: 1. New Content Launch Checklist Every new page should go through a consistent SEO review before publishing:
- Keyword research completed
- Title tag optimized
- Meta description written
- URL structure follows conventions
- Header hierarchy is logical
- Internal links added from 3-5 relevant existing pages
- Images have descriptive alt text
- Schema markup implemented (if applicable)
- Mobile preview reviewed
- Page indexed in GSC (after publication) 2. Monthly GSC Review Process Consistent monthly reviews identify problems early and surface opportunities: Week 1 of each month:
- Export previous month's performance data from GSC
- Compare to prior month and same month last year
- Flag major changes
- Identify top 10 Quick Win opportunities
- Update prioritization matrix
- Plan sprint tasks for the month 3. Content Refresh Process Systematic approach to keeping content current: Trigger: Page traffic declines >20% over 3 months (GSC monitoring flags this) Process:
- Analyze GSC query data: Has search intent shifted?
- Review current content: What's outdated? What's missing?
- Check competition: What do top-ranking pages include that yours doesn't?
- Update: Statistics, examples, screenshots, new sections as needed
- Add 200-500 words of new content addressing gaps
- Refresh publish date
- Update internal links
- Monitor: Track GSC performance for 4-6 weeks after refresh 4. Technical SEO Monitoring Process Weekly or bi-weekly technical health checks:
- Check GSC for new coverage issues or indexing errors
- Review Core Web Vitals
- Check for broken internal links
- Monitor site speed
- Review security issues or manual actions in GSC
- Verify XML sitemap is current and accessible
- Check for new 404 errors (fix or redirect) 5. Link Building/Outreach Process If link building is part of your strategy:
- Identify linkable assets
- Find relevant link prospects
- Personalized outreach
- Follow-up sequence
- Track results [VISUAL: Process flowchart example showing "Content Publication SEO Checklist" with decision points and actions]
Building SEO into Existing Workflows
SEO shouldn't be a separate silo that reviews work after it's done. Build SEO checkpoints into existing product and content workflows. Integration Points: Content Team Workflow: Traditional (inefficient): Content team writes articles → publishes → SEO reviews later → requests changes → content team revises → republishes Integrated (efficient): Content team follows SEO brief from start → uses title/header template → SEO spot-checks before publish → launches optimized How to integrate:
- Create SEO content briefs that answer: What keyword? What search intent? What should the title be? What questions must we answer?
- Provide templates for headers, meta descriptions, internal linking
- Build SEO review into content workflow before publish (not after) Product/Development Workflow: Traditional (inefficient): Product team builds feature → launches → SEO discovers technical issues → requests fixes → dev team has moved on to next feature Integrated (efficient): SEO reviews technical specifications during planning → identifies SEO requirements → dev implements as part of feature build How to integrate:
- Add SEO to sprint planning meetings
- Create technical SEO requirements checklist for new features
- Include SEO in acceptance criteria Design Workflow: Traditional (inefficient): Design team creates page layouts → builds them → SEO says "we need more header text" → design compromised Integrated (efficient): SEO provides content requirements during design → designs accommodate SEO needs from start → no compromises needed How to integrate:
- Share header hierarchy requirements early
- Explain space needed for text
- Collaborate on internal linking strategies in navigation design [VISUAL: RACI matrix showing SEO responsibilities across teams - Responsible, Accountable, Consulted, Informed for major activities]
Creating Accountability Systems
Documented processes only work if people follow them. Accountability systems ensure consistency. Accountability Mechanisms: 1. Checklists at Decision Points Make it impossible to skip steps:
- Content can't be published until checklist is completed
- Code can't be deployed until technical SEO review is done
- New pages aren't added to sitemap until meta data is added 2. Automated Alerts Set up monitoring that flags issues automatically:
- Alert when pages lose >20% traffic month-over-month
- Alert when GSC coverage errors increase
- Alert when Core Web Vitals scores drop to "Poor"
- Alert when important pages de-index 3. Regular Reviews Schedule recurring reviews:
- Weekly SEO team sync (15 minutes): Blockers? Quick wins? Priorities?
- Monthly performance review (30 minutes): Results? Learnings? Next month's plan?
- Quarterly strategic review (2 hours): Major initiatives? Resource allocation? Strategy adjustments? 4. Shared Dashboards Make SEO metrics visible to everyone:
- Shared dashboard showing organic traffic, conversions, key GSC metrics
- Visible to entire company
- Updated automatically (daily or weekly) 5. Ownership Assignment Make it clear who owns what:
- Content lead owns blog SEO metrics
- Product lead owns product page SEO performance
- Dev lead owns technical SEO health When everyone owns "SEO" generally, no one owns it specifically. Assign clear ownership.
Training and Knowledge Sharing
Systems are only as good as the people executing them. Invest in training team members so SEO becomes everyone's job, not one person's responsibility. Training Approaches: 1. Role-Specific Training Different roles need different SEO knowledge: Content writers need to know:
- How to read a content brief with SEO requirements
- Title tag and meta description best practices
- Header hierarchy and structure
- Basic keyword research Developers need to know:
- Technical SEO fundamentals
- How to implement schema markup
- Mobile optimization requirements
- Common technical issues and how to avoid them Product managers need to know:
- How to evaluate SEO impact of product decisions
- Search demand research
- SEO as a user acquisition channel and its metrics 2. Documentation and Resources Create internal documentation:
- SEO style guide
- Technical SEO requirements
- Process documentation
- FAQ 3. Lunch and Learns Monthly 30-minute sessions where you teach one SEO concept:
- "How to Use GSC to Find Content Ideas"
- "Title Tag Optimization 101"
- "Why Site Speed Matters and How We Measure It" 4. Mentorship and Pairing Pair less experienced team members with SEO experts:
- Junior content writer shadows SEO lead during optimization
- Junior developer implements technical SEO task with oversight
- Hands-on learning builds skills faster than documentation alone
Avoiding Single Points of Failure
The biggest risk to sustainable SEO: one person holds all knowledge. If they leave, the program collapses. How to Avoid This: 1. Document Everything All processes, all learnings, all context should be written down:
- Process documentation
- Experiment log
- Decision logs
- Playbooks 2. Cross-Train Team Members Everyone should have a backup:
- Two people know how to do technical audits
- Two people can run GSC analysis and identify opportunities
- Two people understand the prioritization framework 3. Build Systems, Not Hero-Dependent Processes Design workflows that work even without the expert present:
- Automated alerts catch problems
- Checklists guide execution
- Templates provide structure 4. Create Succession Plans If the SEO lead left tomorrow:
- Who would take over?
- What knowledge transfer would they need?
- What documentation exists to support them? Answer these questions now, before they're urgent. [VISUAL: Diagram showing interconnected systems with no single point of failure - multiple people can execute each process, documentation supports all workflows]
Common Strategy Pitfalls (and How to Avoid Them)
Even with frameworks, data, and good intentions, SEO strategies fail in predictable ways. Recognizing these pitfalls avoid them. Pitfall 1: Analysis Paralysis What it looks like: Spending weeks analyzing GSC data, creating elaborate reports, and debating priorities—without ever executing anything. Why it happens: Fear of making the wrong choice. Desire for perfect information before deciding. Comfort with analysis over action. The cost: Every week spent analyzing instead of executing costs you real traffic and revenue. The Quick Win you identified two months ago would have already shown results by now. How to avoid it:
- Set analysis time limits: "We'll spend 2 hours on prioritization, then we execute"
- Use the 80/20 rule: Make decisions with 80% confidence, not 100%
- Default to action: When unsure between two good options, pick one and start
- Remember: Most SEO changes are reversible—if something doesn't work, you change it Pitfall 2: Chasing Shiny Objects What it looks like: Constantly switching strategies based on the latest blog post, conference talk, or competitor tactic you discovered. Never finishing what you started because something new sounds more interesting. Why it happens: FOMO (fear of missing out). Boredom with current work. Mistaking novelty for effectiveness. The cost: You're always starting but never finishing. You never build on successes because you abandon tactics before measuring results. How to avoid it:
- Commit to testing periods: "We'll try this approach for 8 weeks, then evaluate"
- Evaluate new tactics against your prioritization framework (impact vs effort)
- Ask: "Is this a better opportunity than what we're currently working on?"
- Remember: Finishing 10 Quick Wins beats starting 50 "interesting" projects Pitfall 3: Ignoring Quick Wins for "Strategic" Projects What it looks like: Focusing entirely on big, impressive-sounding projects while ignoring dozens of Quick Wins that could be completed in hours. Why it happens: Big projects feel more strategic and important. They make better presentations to executives. Quick Wins feel tactical and small. The cost: You're leaving significant revenue on the table while pursuing projects with longer timelines and uncertain outcomes. How to avoid it:
- Allocate resources explicitly: 50% to Quick Wins, 50% to Major Projects
- Track cumulative impact of Quick Wins: "12 Quick Wins this quarter = $60K revenue"
- Remember: Strategic projects are only worthwhile if they have more impact than accumulated Quick Wins—often they don't
- Use Quick Wins to fund Major Projects: Show results fast, earn credibility, get budget for bigger initiatives Pitfall 4: Copying Competitors Blindly What it looks like: Seeing a competitor do something and immediately doing the same thing without understanding why they did it or whether it worked for them. Why it happens: Fear that competitors know something you don't. Assumption that what works for them will work for you. Easier than doing your own analysis. The cost: You waste resources on tactics that might not work for your site, audience, or business model. You become reactive instead of strategic. How to avoid it:
- Analyze competitor moves but don't copy: "They did X, why? What are they trying to achieve?"
- Use GSC data to evaluate if you have the same problem: "They built a glossary—do we have search demand for definitional queries?"
- Remember: Competitors make mistakes too. Just because they're doing it doesn't mean it works.
- Lead with your data: Start with your GSC insights, use competitive analysis to supplement, not drive Pitfall 5: Over-Optimizing for Edge Cases What it looks like: Spending weeks optimizing pages that get 50 impressions per month, or building features for 0.1% of your queries, or perfecting pages that already perform well. Why it happens: Perfectionism. Desire to cover all bases. Avoiding harder, more impactful work. The cost: Enormous opportunity cost. Every hour spent on an edge case is an hour not spent on a Quick Win or Major Project. How to avoid it:
- Use the 80/20 rule: Focus on the 20% of pages/queries that drive 80% of traffic
- Set minimum thresholds: "We only optimize pages with >1,000 monthly impressions"
- Calculate opportunity cost: "This page could gain 50 clicks vs this page could gain 500 clicks—which is better use of time?"
- Remember: Good enough is often perfect—don't optimize what already works well Pitfall 6: Forgetting to Measure Results What it looks like: Completing a bunch of optimizations but never going back to check if they worked. Moving on to the next task without validating the previous one. Why it happens: Impatience. Excitement about the next opportunity. Fear of discovering something didn't work. The cost: You never learn what works for your site. You might be repeating failed tactics and ignoring successful ones. You can't prove ROI. How to avoid it:
- Set measurement deadlines: "We'll check results 4 weeks after completing this optimization"
- Use a tracking spreadsheet: Log every significant change with date and expected outcome
- Block time for measurement: Every Friday afternoon, review what you completed 3-4 weeks ago
- Celebrate wins and analyze failures: Both are learning opportunities Pitfall 7: Setting Too Many Priorities What it looks like: Everything is high priority. You have 20 "top priority" initiatives. When asked what's most important, you say "all of them." Why it happens: Inability to say no. Fear of missing opportunities. Pressure from multiple stakeholders. The cost: When everything is a priority, nothing is. Your team spreads effort across too many initiatives, completes none well, and makes slow progress everywhere instead of fast progress somewhere. How to avoid it:
- Forced ranking: Number your priorities 1, 2, 3, etc. Only 1 can be #1.
- Limit active work: "We can have maximum 5 active initiatives at once"
- Use "yes, and" instead of "yes": "Yes, that's important, and we'll address it in Q3 after we complete current priorities"
- Remember: Prioritization means choosing what NOT to do as much as what to do [VISUAL: Checklist titled "Strategy Red Flags" with 10-12 warning signs that your strategy is off track]
Conclusion: From Strategy to Execution
This guide has given you the frameworks to bridge the gap from data to action: The prioritization framework (Impact vs Effort matrix) transforms overwhelming opportunity lists into clear priorities. You know what to work on first because you've calculated potential impact and estimated required effort. Quick Wins, Major Projects, Fill-Ins, and Time Wasters—each quadrant has a clear action plan. Resource allocation strategies ensure you execute instead of getting stuck in planning mode. You know how to balance core optimization work, strategic experiments, and maintenance. You understand when to hire, when to outsource, and when to work within current constraints. Business case building connects SEO metrics to business outcomes. You can translate clicks into revenue, calculate opportunity costs, and present ROI to stakeholders in their language. You can get budget, buy-in, and resources because you speak the language of business impact, not SEO metrics. Stakeholder communication ensures your strategy doesn't die from lack of support. You tailor messages to different audiences, set realistic expectations, and manage the "how long until we rank #1?" conversation productively. You build cross-functional buy-in because you make SEO everyone's opportunity, not the SEO team's responsibility. Measurement and attribution prove that your work generates results. You track leading indicators (impressions, position) to predict lagging indicators (traffic, revenue). You know when to persist and when to pivot. You connect SEO efforts to business outcomes through attribution modeling. Agile methodologies create a culture of experimentation and continuous improvement. Sprint cycles keep you moving fast, hypothesis-driven testing learn systematically, and the build-measure-learn loop compounds your knowledge. You're not guessing—you're testing, measuring, and scaling what works. Scaling strategies multiply your impact through pattern recognition and template-level optimization. You optimize 1,000 pages with the effort it would take to optimize 10. You build systems that compound results over time instead of tactics that produce one-time wins. Sustainable systems ensure your SEO program survives transitions and scales with your company. Documented processes, integrated workflows, accountability mechanisms, and knowledge sharing create institutional capability that doesn't depend on any single person.
The Three Principles of Evidence-Based SEO
What's the potential traffic gain? What's the business value? Let evidence settle debates. 2. Prioritization is a skill, not a one-time exercise You'll get better at estimating impact and effort as you gain experience. Your first prioritization matrix will have inaccurate scores. That's fine. Track actual results, adjust your scoring approach, and improve over time. Re-prioritize quarterly as you learn. 3. Small, consistent actions beat perfect plans The perfect strategy executed slowly loses to the good strategy executed fast. Bias toward action. Complete 10 Quick Wins this month rather than planning the perfect comprehensive program for six months. Momentum creates momentum. Results fund reinvestment. Progress beats perfection.
Your Next Steps
Each successful experiment teaches you something about your site and audience. Each system you build multiplies your future capacity. In three months, you'll have completed dozens of optimizations, validated which tactics work for your site, and built momentum with stakeholders. In six months, you'll have systems in place that catch opportunities automatically and workflows that build SEO into every new page launch. In a year, you'll have transformed SEO from a siloed function into an integrated growth system. But compounding only works if you start. The traffic you're not gaining today won't magically appear tomorrow. The Quick Wins in your GSC data won't fix themselves. The Major Projects you need won't complete through wishful thinking. Your Google Search Console is filled with data. Now you know how to turn it into action. Start today. [VISUAL: Call-to-action box with clear next steps and link to product trial]
Related Resources
Deep-dive into specific tactics from this guide:
- How to Prioritize SEO Tasks Using GSC Data - Detailed walkthrough of the Impact vs Effort framework with real examples
- Quick Wins: 10 GSC Insights You Can Act on Today - Specific opportunities you can execute this week
- Content Optimization Strategy: Using GSC Data - Systematic approach to scaling content improvements
- Scaling SEO: Page Optimization Template Strategy - Apply optimizations at scale using template-level changes
- SEO Recovery Plan: Traffic Drop Framework - Systematic approach to recovering from traffic losses Foundational GSC knowledge:
- Complete Guide to Google Search Console Analysis - Complete guide to understanding and using GSC effectively
- How to Read Your GSC Performance Report - Interpreting metrics and filtering data
- GSC Queries Report: Biggest Opportunities - Identifying high-potential keywords
- Pages Report Analysis: Best and Worst Performers - Diagnosing page-level performance Strategic frameworks:
- Setting Realistic SEO Goals - Connecting SEO work to business outcomes
- Building an SEO Roadmap from Performance Data - Long-term strategic planning
- SEO Reporting for Stakeholders - Communicating results to stakeholders
Ready to turn your GSC data into actionable strategy? Our platform analyzes your Google Search Console data and provides AI-powered prioritization recommendations, automated opportunity detection, and executive-ready ROI reporting. Get started with a free trial and see your top Quick Wins within minutes. Start Your Free Trial →
Last updated: January 2026