Google Search Console Analysis: Complete Guide
Master Google Search Console with this comprehensive 10,000-word guide. Analyze performance data, fix indexing issues, optimize Core Web Vitals, and turn GSC insights into traffic growth.

The Complete Guide to Google Search Console Analysis
Google Search Console is the most powerful free SEO tool available—yet most website owners barely scratch its surface. beginners might check their click counts occasionally but power users leverage GSC to uncover hidden opportunities, diagnose technical issues before they impact rankings, and make data-driven decisions that drive sustainable organic growth. The difference between these two approaches isn't just knowledge—it's results. This comprehensive guide transforms you from a casual GSC user into someone who can extract every insight, fix every issue, and capitalize on every opportunity hiding in your data. What This Guide Covers: This is the most comprehensive Google Search Console resource available. Across 9,500+ words, you'll learn everything from basic setup to advanced analysis techniques. We cover all major GSC reports, explain what your data means, show you how to fix common issues, and teach you to connect metrics to business outcomes. Who This Guide Is For:
- Beginners: Never used Google Search Console? New to SEO entirely? Start with our SEO basics guide first, then return here for GSC mastery.
- Intermediate users: Already familiar with the basics? Jump to advanced filtering, Core Web Vitals, or API access sections.
- Advanced SEOs: Use this as your reference guide and discover techniques you may have missed.
- Business owners: translate GSC data into revenue and growth insights.
How to Use This Guide:
Read straight through for comprehensive mastery, or use the table of contents to jump directly to the sections most relevant to your needs. Each section stands alone while linking to related topics for deeper dives.
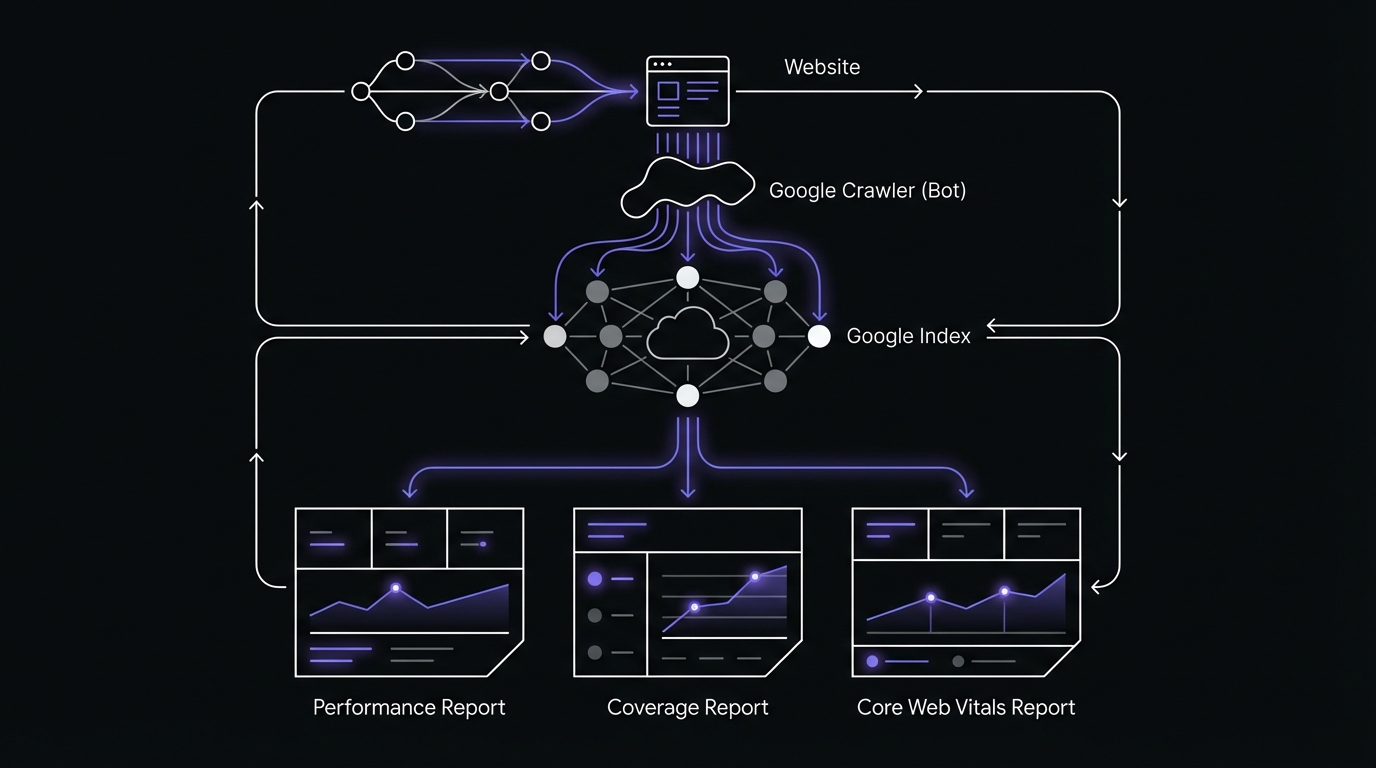
Table of Contents
- What Is Google Search Console?
- Setting Up Google Search Console Properly
- Performance Report: Your Most Important Data
- Index Coverage Report: Ensuring Google Sees Your Content
- URL Inspection Tool: explore Individual Pages
- Core Web Vitals Report: Page Experience Signals
- Mobile Usability Report
- Enhancements: Rich Results and Structured Data
- Security & Manual Actions
- Links Report: Understanding Your Backlink Profile
- Experience Report: Aggregated Page Experience
- Sitemaps Section: Keeping Google Updated
- Removals: Temporarily Removing Content from Search
- Crawl Stats Report: Understanding Googlebot Activity
- Settings & Users: Managing Your Property
- Common GSC Pitfalls and How to Avoid Them
- Connecting GSC Data to Business Outcomes
- Advanced GSC Analysis Techniques
- GSC Best Practices Checklist
- Conclusion & Next Steps
The History and Evolution of GSC
Google Search Console hasn't always existed in its current form. Understanding its evolution helps explain some of its quirks and why certain features exist. Google Webmaster Tools Era (2006-2015): Originally launched as Google Sitemaps in 2005 and rebranded to Google Webmaster Tools in 2006, the platform primarily focused on technical webmaster tasks: submitting sitemaps, identifying crawl errors, and monitoring backlinks. The interface was utilitarian and the data was basic. Transition to Search Console (2015): Google rebranded Webmaster Tools to Search Console in 2015, signaling a shift from purely technical tool to a broader search performance platform. This change acknowledged that SEO had evolved beyond webmasters—marketers, business owners, and content creators needed search data too. Key Feature Additions Over Time:
- 2016: Performance Report introduced
- 2018: New GSC interface rolled out, major UX overhaul
- 2019: Domain properties introduced via DNS verification
- 2020: Core Web Vitals report added as page experience became a ranking signal
- 2021: Page Experience report introduced
- 2024: INP replaced FID (First Input Delay) as a Core Web Vital
- 2025-2026: Enhanced mobile-first indexing reporting and improved indexing transparency Mobile-First Indexing Changes: Perhaps the most significant evolution came with Google's shift to mobile-first indexing (fully rolled out by 2021). GSC adapted to show mobile crawl data as primary, reflecting how Google now predominantly uses the mobile version of your content for indexing and ranking. This fundamentally changed how SEOs needed to use GSC—desktop data became secondary.
GSC vs Google Analytics: Understanding the Difference
One of the most common points of confusion: "Why doesn't my GSC click data match my Google Analytics sessions?" These tools measure fundamentally different things: Google Search Console Measures:
- Search appearances: How many times your site appeared in search results (impressions)
- Search clicks: Clicks from Google Search to your site
- Pre-visit data: Queries, positions, CTR before users arrive
- Google's perspective: How Google sees and crawls your site
- Technical health: Indexing status, crawl errors, mobile usability Google Analytics Measures:
- On-site behavior: What visitors do after arriving
- All traffic sources: Organic, paid, social, direct, referral
- User engagement: Time on site, pages per session, conversions
- User perspective: How real humans interact with your content
- Business outcomes: Goals, ecommerce transactions, conversion funnels Why the Numbers Don't Match:
- GSC counts clicks; GA counts sessions: One click can create multiple sessions (user leaves and returns)
- Tracking limitations: Ad blockers affect GA but not GSC
- Data processing differences: Different attribution models and time zones
- Safari ITP and privacy: GA impacted more by privacy features
- Bot filtering: GA filters bots; GSC shows actual search clicks including some bots When to Use Which Tool: Use Google Search Console when you need to:
- Identify keyword opportunities
- Diagnose technical SEO issues
- Understand search visibility and performance
- Monitor indexing status
- Track Core Web Vitals and mobile usability
- Find which pages appear in search Use Google Analytics when you need to:
- Understand user behavior on-site
- Track conversions and revenue
- Analyze traffic sources beyond Google Search
- Measure engagement metrics
- Build customer journey funnels How They Complement Each Other: The most insights come from using both together:
- GSC shows a query driving impressions but low clicks → Check GA to see if the landing page has high bounce rate
- GA shows organic traffic dropped → Check GSC to see if rankings or impressions declined
- GSC shows pages getting clicks → Check GA to see if those clicks convert
 New to SEO? Learn the fundamentals in our SEO basics guide before diving into GSC analysis.
Setting Up Google Search Console Properly
Proper GSC setup is critical—mistakes here mean incomplete data or, worse, no data at all. Many site owners discover months later they've been collecting data for the wrong property variation or missing subdomains entirely. For a complete, step-by-step setup tutorial, see our dedicated guide: How to Set Up Google Search Console for Accurate Data Collection. The overview below covers key concepts, but the full guide includes troubleshooting, verification method comparisons, and post-setup configuration.
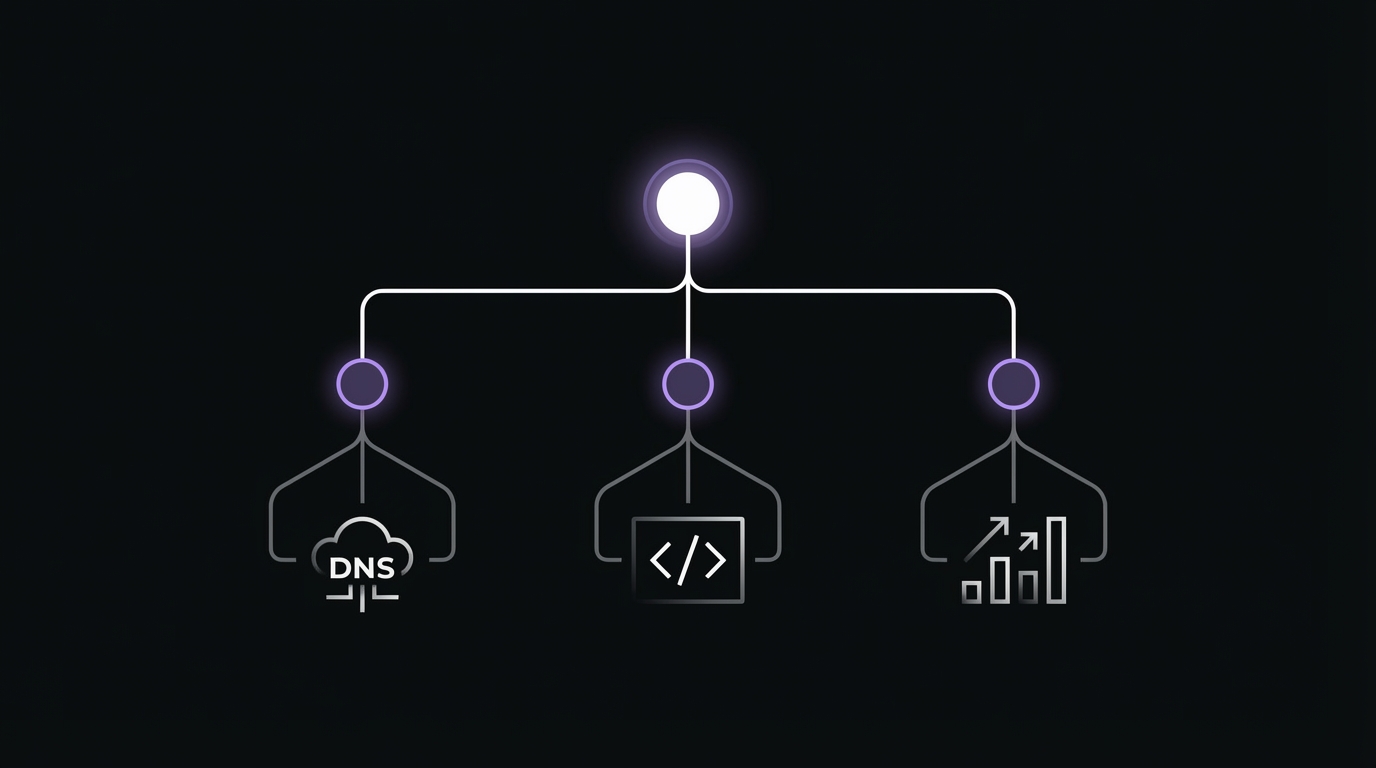
Verification Methods
Google offers five verification methods, each with distinct advantages and ideal use cases. Choosing the right one prevents future headaches.
HTML File Upload
How it works: Download a unique HTML file from GSC and upload it to your website's root directory. Pros:
- Simple, straightforward process
- No code modifications needed
- One-time setup Cons:
- Requires FTP or hosting panel access
- File can be accidentally deleted during site migrations
- Doesn't verify if file is removed Best for: Static sites, users comfortable with file management, developers with hosting access. Step-by-step:
- In GSC, select HTML file verification method
- Download the verification file
- Upload to your root directory
- Verify file loads in browser
- Return to GSC and click "Verify"
HTML Meta Tag
How it works: Add a meta tag to your homepage's <head> section.
Pros:
- CMS-friendly
- No file management required
- Easy to implement via plugins or theme editors Cons:
- Must remain on homepage permanently
- Can be accidentally removed during theme updates
- Only works if properly placed in
<head>Best for: WordPress sites, CMS platforms, non-technical users, sites using tag managers. Step-by-step:
- Copy the meta tag from GSC
- Access your site's header:
- WordPress: Appearance → Theme Editor or SEO plugin settings
- Shopify: Online Store → Themes → Edit Code
- Other CMS: Header injection or tag manager
- Paste tag inside
<head>section of homepage - Save and verify tag appears in page source
- Return to GSC and click "Verify" [Screenshot: Meta tag in GSC interface]
Google Analytics Verification
How it works: If Google Analytics tracking code is already on your site and you have Admin access to the GA property, GSC can verify through GA. Pros:
- Instant verification if GA is already set up
- No additional code needed
- Automatic if prerequisites are met Cons:
- Requires GA tracking code on all pages
- Must have Admin access to GA property
- Verification tied to GA property Best for: Sites already using Google Analytics, quick verification, connecting GSC and GA data. Requirements:
- Google Analytics tracking code installed site-wide
- Admin role in Google Analytics property
- Same Google account for GSC and GA [Screenshot: Google Analytics verification option]
Google Tag Manager Verification
How it works: Verifies through your existing GTM container. Pros:
- Works if GTM is already implemented
- Container-level verification
- No additional tags needed Cons:
- Requires published GTM container
- Must have Publish permission in GTM
- Less common than GA method Best for: Sites using GTM, advanced implementations, marketing teams already managing tags via GTM. Requirements:
- GTM container published and live on site
- Publish permission in Google Tag Manager account
- Container loading on all pages [Screenshot: GTM verification method selection]
DNS Verification
How it works: Add a TXT record to your domain's DNS settings at your domain registrar. Pros:
- Verifies entire domain including all subdomains
- Most robust method—never affected by site changes
- Required for domain properties
- Professional standard
- Persists through site migrations, platform changes, redesigns Cons:
- Requires DNS access
- DNS propagation can take 5 minutes to 48 hours (usually <1 hour)
- Slightly more technical than other methods Best for: Domain properties (required), agencies managing multiple sites, professional implementations, long-term stability. Step-by-step:
- In GSC, select DNS verification method
- Copy the TXT record value
- Log in to your domain registrar
- Navigate to DNS settings/DNS management
- Add new TXT record:
- Host/Name: @
- Type: TXT
- Value: Paste the verification string from GSC
- TTL: Automatic or 3600
- Save DNS record
- Wait for DNS propagation
- Return to GSC and click "Verify" Troubleshooting DNS verification:
- If verification fails, wait longer
- Ensure no extra spaces in TXT record value
- Verify you added to root domain, not subdomain
- Use DNS checker tool: mxtoolbox.com/TXTLookup.aspx [Screenshot: DNS TXT record in GSC] [Screenshot: Example DNS settings panel showing TXT record]
Which Verification Method Should You Choose?
Decision flowchart:
- Setting up a domain property? → Use DNS verification (required)
- Already using Google Analytics or GTM? → Use GA or GTM verification (fastest)
- Have FTP/hosting access? → Use HTML file upload
- Using a CMS like WordPress? → Use HTML meta tag (easiest)
- Want maximum stability? → Use DNS verification
Property Types: Domain vs URL Prefix
This is a key decisions in GSC setup, yet many users don't understand the difference.
Domain Property (sc-domain:example.com)
What it includes:
- All subdomains: www, blog, shop, help, m, etc.
- All protocols: http AND https
- All paths on all subdomains
Example: A domain property for
example.comincludes: https://www.example.comhttp://example.comhttps://blog.example.comhttps://shop.example.com/productshttps://m.example.comVerification: DNS only (TXT record required) Advantages:- Complete data in one place
- Automatically includes new subdomains
- Simplified management
- Reflects how most sites operate
- Recommended by Google as modern standard
URL Prefix Property (e.g., https://www.example.com)
What it includes:
- Specific protocol only
- Specific subdomain only
- All paths under that exact URL prefix
Example: A URL prefix property for
https://www.example.comincludes: https://www.example.com/blog/posthttps://www.example.com/productsBut does NOT include:http://www.example.com(different protocol)https://example.com(different subdomain)https://blog.example.com(different subdomain) Verification: Any method Advantages:- Granular data separation
- Specific subdomain tracking
- Works if you don't have DNS access [Diagram: Domain vs URL prefix coverage visualization]
Which Property Type Should You Use?
Use Domain Property if:
- You want complete data in one view
- You have subdomains
- You're setting up GSC for the first time
- You have DNS access
- You want simplicity and completeness Use URL Prefix Property if:
- You need to separate http vs https data (rare need)
- You need to isolate www vs non-www data (rare need)
- You manage subdomains as completely independent sites
- You don't have DNS access
- You need to track a specific subdomain separately Recommendation: Domain property is the modern standard. Use this unless you have a specific, compelling reason not to.
Can You Have Both?
Yes, and this is common during transitions or for specific troubleshooting:
- Domain property for overall performance and complete picture
- URL prefix properties for specific subdomain deep-dives
- Data is not duplicated—they're different views of the same underlying data Example property structure for a site with blog subdomain:
sc-domain:example.com(domain property - main view)https://www.example.comhttps://blog.example.comThis gives aggregate data in the domain property while allowing detailed analysis of specific subdomains. [Screenshot: Multiple properties for the same site in property selector]
Initial Setup Checklist
After verifying your property, complete these critical configuration steps:
1. Submit Your Sitemap
Sitemaps tell Google which pages you want indexed and how they're organized. Steps:
- Navigate to Sitemaps section in left sidebar
- Enter your sitemap URL:
- WordPress: Usually
/sitemap.xmlor/sitemap_index.xml - Shopify:
/sitemap.xml - Custom sites: Check your CMS or consult developer
- Click Submit
- Wait for processing (can take hours to days)
- Check for "Success" status Common sitemap locations:
/sitemap.xml/sitemap_index.xml/sitemap.xml.gz/wp-sitemap.xml(WordPress 5.5+) [Screenshot: Sitemap submission and success confirmation]
2. Set Up Email Notifications
Don't miss critical alerts about your site's search presence. Steps:
- Go to Settings (gear icon)
- Find "Email notifications" section
- Configure alert preferences:
- Recommended: Enable all alerts
- Critical: Manual actions, security issues, indexing problems
- Add multiple email addresses for redundancy What you'll be notified about:
- Manual actions (penalties)
- Security issues (hacking, malware)
- Critical indexing errors
- Core Web Vitals degradation
- Mobile usability issues
3. Connect to Google Analytics
Linking GSC and GA4 richer analysis and cross-platform insights. Steps:
- In GSC, go to Settings → Associations
- Click "Associate" next to Google Analytics
- Select your GA4 property
- Confirm association Benefits:
- View GSC data inside GA4 reports
- Correlate search queries with on-site behavior
- Build unified dashboards
- Better attribution modeling
4. Add Team Members
Give your team appropriate access without sharing your Google account. Permission levels:
- Owner: Full control, can add/remove users, delete property
- Full User: View all data, take most actions (cannot manage users)
- Restricted User: View most data, limited actions Steps:
- Go to Settings → Users and permissions
- Click "Add user"
- Enter email address
- Select permission level
- User receives email invitation Best practices:
- Have at least 2 owners (prevents lockout)
- Agencies: Use Full User, not Owner
- Content team: Restricted User is sufficient
- Document who has access and why [Screenshot: Settings panel with key configurations highlighted]
5. Set International Targeting (if applicable)
Only relevant for URL prefix properties targeting specific countries. When to use:
- URL prefix property only
- Site targets specific country
- Using ccTLD isn't feasible Steps:
- Go to Settings (in legacy section)
- Find International Targeting
- Select target country
Managing Multiple Properties
Common scenarios requiring multiple GSC properties: Scenario 1: Subdomains
- Solution: Domain property covers everything automatically
- Alternative: Separate URL prefix for each subdomain if managed by different teams Scenario 2: International Sites (Different Domains)
example.com(US)example.co.uk(UK)example.de(Germany)- Solution: Separate domain property for each ccTLD Scenario 3: Migration (HTTP to HTTPS)
- Setup: Add HTTPS property before migration
- During migration: Monitor both properties
- After migration: HTTPS property becomes primary, keep HTTP for historical reference Scenario 4: Subdirectories by Market
example.com/us/example.com/uk/example.com/de/- Solution: One domain property, use filters to analyze each market [Screenshot: Property selector showing organized multiple properties] [Link to: How to Set Up Google Search Console for Accurate Data Collection (Cluster #1)]
Performance Report: Your Most Important Data
The Performance Report is where you'll spend 80% of your GSC time. It shows exactly how your site performs in Google Search: which queries trigger your pages, how often you appear, how often users click, and what positions you rank at. guide guides:
- How to Read Your GSC Performance Report (Beginner's Guide) - Start here if you're new to the Performance Report
- Understanding the GSC Performance Report: What Your Data Is Really Telling You - interpret patterns and trends
- GSC Filters and Comparisons: Complete Tutorial - Master advanced filtering techniques
Understanding the Four Core Metrics
Clicks
What it measures: The number of times a user clicked through to your website from a Google Search result. What counts as a click:
- User clicks your search result
- User clicks "More results" on a featured snippet then clicks your result
- Clicks from Google Images What doesn't count:
- User views result but doesn't click
- User clicks then immediately backs out
- Clicks from Google Discover, News (separate reports) not identical to GA sessions but clicks represent users actively choosing your site.
Impressions
What it measures: How many times your site appeared in search results, regardless of whether it was scrolled into view. When Google counts an impression:
- Your result appears in search results (even below the fold)
- User opens search results page containing your link
- Pagination: Each page of results counts separately What doesn't count:
- Result exists but user doesn't reach that page of results
- Result filtered out by personalization High impressions with low clicks indicate CTR optimization opportunities. Low impressions mean ranking or targeting issues. To understand the relationship between these metrics and what it reveals about your content, see our analysis of GSC impressions vs clicks and how to read the gap.
CTR (Click-Through Rate)
What it measures: Percentage of impressions that resulted in clicks.
Calculation: (Clicks / Impressions) × 100
Example: 100 clicks from 2,000 impressions = 5% CTR
What's "good" CTR:
- Position 1: 25-35% (broad queries), 40-60% (branded queries)
- Position 2-3: 10-20%
- Position 4-5: 7-12%
- Position 6-10: 3-8%
- Position 11-20: 1-3% Factors affecting CTR:
- Search position
- Title tag quality
- Meta description appeal
- Rich results (FAQ, ratings, etc.)
- Brand recognition
- Query intent match
- Competition in SERP Low CTR at high positions means optimization opportunity. High CTR at low positions suggests strong title/description but need for better rankings. For a comprehensive analysis of what your CTR data reveals and how to act on it, see our guide on how to interpret GSC CTR data.
Average Position
The most misunderstood metric in GSC. What it measures: The average position your site appeared at across all impressions for a query. How it's calculated:
- Not your current ranking
- Average across all impressions in the date range
- Weighted by impression volume
- Can be decimal (e.g., 4.7) Example calculation:
- Query "seo tools" had:
- 100 impressions at position 5
- 50 impressions at position 8
- Average position =
(100 × 5 + 50 × 8) / 150 = 5.67Why it fluctuates: - Rankings change throughout the day
- Personalization shows different results to different users
- Different result types
- Geographic variations
- Featured snippet appearances
- SERP features pushing results down What it tells you:
- Approximate visibility range
- Trend direction
- Comparative performance across queries
- Pages close to page 1 What it doesn't tell you:
- Your exact ranking right now
- Ranking for specific user in specific location
- Competitive positioning Common misinterpretation: "My average position is 7, but when I search, I'm in position 5!"
- Explanation: Your personal search shows one snapshot. Average position reflects thousands of impressions across different users, locations, times, and personalization factors. For a explore what average position means and how to use it effectively, read our complete guide on position tracking and average position explained. [Screenshot: Performance Report dashboard with all four metrics] [Chart: Average CTR by position benchmark data]
Reading the Performance Chart
The line graph at the top of the Performance Report reveals traffic patterns and trends.
Trend Identification Techniques
Upward trend: Consistent growth week-over-week
- Good signs: Seasonal content gaining traction, new content performing, technical improvements paying off
- Action: Identify what's working and double down Downward trend: Consistent decline
- Potential causes: Algorithm update, competitor gains, technical issues, seasonality
- Action: Investigate index coverage, check for penalties, analyze specific queries dropping Plateau: Flat performance
- Indication: Hit ceiling for current strategy
- Action: Expand keyword targeting, improve content quality, build links Spiky pattern: Erratic ups and downs
- Common causes: News/trending topics, manual indexing issues, crawl budget problems
- Action: Investigate specific dates with spikes/drops Seasonal pattern: Predictable cyclical changes
- Examples: Tax prep (January-April peak), Holiday gifts
- Action: Prepare content in advance of seasonal peaks [Screenshot: Performance chart showing various trend patterns]
Comparing Date Ranges Effectively
Year-over-Year (YoY) comparison:
- Compare last 28 days to same 28 days last year
- Accounts for seasonality
- Shows true growth independent of seasonal fluctuations
- Best for: Understanding genuine growth trends Month-over-Month (MoM) comparison:
- Compare this month to last month
- Shows recent changes quickly
- Affected by seasonality
- Best for: Detecting recent issues or wins Week-over-Week (WoW) comparison:
- Compare last 7 days to previous 7 days
- Detects immediate changes
- Highly volatile
- Best for: Tracking recent optimizations or diagnosing sudden drops Custom comparisons:
- Compare pre/post algorithm update
- Compare before/after site migration
- Compare before/after content refresh How to compare in GSC:
- Select date range (e.g., Last 28 days)
- Click "Compare" tab
- Choose comparison type or custom dates
- View metrics with +/- change indicators [Screenshot: Date comparison view showing year-over-year analysis]
The Five Performance Report Views
Queries View
Shows search terms that triggered your site in results. What you can find:
- Keywords you rank for (known and unknown)
- Search volume proxies
- Ranking opportunities
- Branded vs non-branded query performance
- Misspellings and variations driving traffic How to use Queries view: Find opportunity queries:
- Filter by position 3-10
- Sort by impressions (descending)
- Look for high-impression queries with low CTR
- Optimize title tags and meta descriptions for these queries Identify content gaps:
- Sort by impressions
- Find queries where you rank but don't have dedicated content
- Create targeted content for high-volume queries Discover new keywords:
- Export query data
- Identify patterns in queries you didn't target
- Expand content to capture more variations Track branded search:
- Filter queries containing brand name
- Monitor branded search growth as brand awareness metric
- Protect branded SERPs from competitors Find low-hanging fruit:
- Filter positions 11-20 (page 2)
- Sort by impressions
- Optimize pages ranking on page 2 to reach page 1 For a complete walkthrough of finding and prioritizing keyword opportunities using the Queries report, see our detailed guide on the GSC Queries report and how to find your biggest opportunities. [Screenshot: Queries report showing opportunity queries highlighted] [Link to: GSC Queries Report: How to Find Your Biggest Opportunities (Cluster #6)]
Pages View
Shows individual URLs that appeared in search results. What you can find:
- Top-performing content
- Underperforming pages that need optimization
- Pages losing traffic
- Pages gaining traffic
- Cannibalization issues How to use Pages view: Identify top performers:
- Sort by clicks
- Analyze what makes these pages successful
- Replicate success patterns in other content Find underperformers:
- Sort by impressions
- Find pages with high impressions but low clicks
- Optimize titles and meta descriptions Detect declining pages:
- Compare to previous period
- Sort by click change
- Investigate pages with significant drops Keyword cannibalization check:
- Click on a page
- Go to Queries tab
- See what queries drive this page
- Check if other pages target the same queries For a systematic approach to identifying your best and worst performing pages and what to do about them, read our comprehensive Pages report analysis guide. Content audit prioritization:
- Export pages data
- Identify pages with impressions but zero clicks
- Prioritize for optimization or consolidation [Screenshot: Pages report showing top performers and underperformers] [Link to: Pages Report Analysis: Identifying Your Best and Worst Performers (Cluster #7)]
Countries View
Shows search performance by country/region. What you can find:
- Geographic distribution of search traffic
- International expansion opportunities
- Unexpected country performance
- Hreflang issues How to use Countries view: Identify expansion opportunities:
- Sort by impressions
- Find countries with high impressions but low clicks
- Consider creating localized content for these markets Verify international targeting:
- Check if primary country aligns with target market
- If wrong country dominates, review hreflang tags
- Ensure content language matches intent Detect regional trends:
- Compare performance across countries
- Identify where your content resonates most
- Tailor content strategy by market For international sites or those looking to expand into new markets, our guide on analyzing the GSC Countries report for international performance insights provides detailed strategies for geographic optimization. [Screenshot: Countries report showing geographic performance]
Devices View
Shows performance segmented by device type: Desktop, Mobile, Tablet. What you can find:
- Mobile vs desktop performance differences
- Mobile-first indexing impact
- Device-specific CTR patterns
- Mobile usability issues indicated by low mobile CTR How to use Devices view: Mobile-first indexing check:
- Compare clicks and impressions across devices
- Mobile should show comparable or higher impressions
- If mobile significantly lags, investigate mobile usability issues Device-specific CTR analysis:
- Compare CTR across devices
- Lower mobile CTR may indicate title tags cut off on mobile
- Higher desktop CTR for certain queries may indicate desktop-preferred intent Optimization prioritization:
- Identify which device drives most traffic
- Optimize experience for dominant device first
- Ensure mobile parity (mobile-first era requirement) Given that Google uses mobile-first indexing, understanding device performance differences is critical. Our detailed Devices report analysis guide shows you how to identify and fix mobile vs desktop performance gaps. [Screenshot: Devices comparison showing mobile vs desktop performance]
Search Appearance View
Shows performance by rich result type (if you have structured data). Rich result types:
- Regular results (standard blue links)
- AMP articles
- FAQ
- HowTo
- Product (with ratings/price)
- Recipe
- Event
- Job posting
- Video What you can find:
- Impact of rich results on CTR
- Which structured data implementations are working
- Opportunities to add structured data How to use Search Appearance: Measure rich result impact:
- Compare CTR of FAQ results vs regular results
- Quantify CTR lift from structured data
- Calculate ROI of schema implementation Identify opportunities:
- See which result types you don't have
- Identify content eligible for rich results
- Implement appropriate schema markup Rich results can dramatically improve your click-through rates and visibility. For a complete analysis of how different rich result types perform and which ones to prioritize, see our guide on understanding Search Appearance and rich results impact. [Screenshot: Search Appearance showing FAQ rich results vs regular results]
Advanced Filtering Techniques
Filters transform GSC from basic reporting tool to powerful analysis platform.
Query Filtering Strategies
Filter by query type:
- Branded: Queries containing "Company Name" → Shows brand awareness
- Non-branded: Queries NOT containing "Company Name" → Shows SEO effectiveness
- Question queries: Queries containing "how" or "what" or "why" → Shows informational content performance
- Commercial intent: Queries containing "buy" or "best" or "review" → Shows bottom-funnel performance Example filter: Find non-branded question queries
- Query contains "how"
- Query doesn't contain "Company Name"
- Sort by impressions
- Reveals informational content opportunities
URL Filtering with Regex
Regular expressions (regex) enable sophisticated page filtering. Common regex patterns: Filter blog posts:
- Custom filter: Page URL
contains regex/blog/Filter product pages: - Custom filter: Page URL
contains regex/product/Filter by category: - Custom filter: Page URL
contains regex/category/[^/]+/?$Exclude parameters: - Custom filter: Page URL
doesn't contain regex\?Multiple subdirectories: - Custom filter: Page URL
contains regex/(blog|news|articles)/[Screenshot: Advanced filter showing regex URL filtering]
Combining Filters for Deep Analysis
The real power comes from combining multiple filters. Example 1: Non-branded blog performance
- Page: URL contains
/blog/ - Query: Doesn't contain "Brand Name"
- Result: See how blog posts perform for non-branded search Example 2: Mobile opportunity queries
- Device: Mobile
- Position: 3-10
- Sort by: Impressions
- Result: High-impression mobile queries where you're close to page 1 Example 3: Question content by country
- Query: Contains "how to"
- Country: United States
- Page: URL contains
/guides/ - Result: How US users engage with tutorial content Example 4: Low-CTR high-rankings
- Position: 1-3
- CTR: < 15%
- Sort by: Impressions
- Result: Pages ranking well but not getting clicks
Custom vs Type Filters
Type filters:
- Built-in GSC filters for common attributes
- Options: Contains, Doesn't contain, Exactly matches, Custom (regex) Inclusion filters:
- Show only data matching criteria
- Use for: Focusing on specific segment Exclusion filters:
- Remove data matching criteria
- Use for: Filtering out noise
Common Performance Report Mistakes
Mistake #1: Only Looking at Total Clicks
The problem: Total clicks are a vanity metric without context. What to do instead:
- Analyze click trends over time
- Segment by query type
- Compare clicks to impressions (CTR context)
- Drill into pages and queries driving clicks
Mistake #2: Ignoring Impression Data
The problem: Impressions show visibility—the full picture of your search presence. Why impressions matter:
- High impressions + low clicks = CTR optimization opportunity
- Declining impressions = ranking problem
- Low impressions = visibility/targeting problem
- Impressions approximate search volume What to do:
- Always view clicks AND impressions together
- Sort by impressions to find opportunity
- Track impression trends as leading indicator
Mistake #3: Not Using Date Comparisons
The problem: Absolute numbers lack context. Is 1,000 clicks good? Depends on whether it's up or down. What to do instead:
- Always compare to previous period
- Use year-over-year to account for seasonality
- Track week-over-week to catch issues early
Mistake #4: Misunderstanding Average Position
The problem: Treating average position as current ranking. Common misconceptions:
- "I'm position 7.2"
- "My position dropped 0.3 points—disaster!"
- "When I search I'm #5, not #7!" What to do instead:
- Use average position for trend direction
- Don't obsess over decimal changes
- Use dedicated rank tracking tools for precise rankings
- Focus on position ranges, not exact numbers
Mistake #5: Not Filtering Data
The problem: Generic aggregated data obscures insights. What to do instead:
- Filter to analyze specific segments
- Separate branded and non-branded performance
- Analyze device performance separately
- Filter by content type
Mistake #6: Forgetting About Data Sampling
The problem: GSC has limitations that affect what you see. Limitations to remember:
- 1,000 row limit in UI (use API for more)
- Anonymous queries
- 16-month data retention What to do instead:
- Use filters to access different 1,000-row segments
- Export data regularly for historical archive
- Use GSC API for sites with >1,000 queries/pages
- Accept you won't see 100% of query data [Link to: Understanding GSC's Data Sampling and Limitations (Cluster #2)]
Mistake #7: Not Acting on Data
The biggest mistake of all. The problem: Viewing reports without implementing insights is wasted effort. What to do instead:
- Create action items from every GSC session
- Prioritize based on potential impact
- Track optimizations and measure results
- Build a regular GSC workflow with outcomes Example action workflow:
- Weekly: Review performance trends → Flag anomalies
- Bi-weekly: Query analysis → Identify 5 optimization opportunities
- Monthly: Page analysis → Content audit priorities
- Quarterly: Comprehensive audit → Strategic adjustments [Infographic: 7 Common GSC Mistakes checklist] [Link to: How to Read Your GSC Performance Report (Beginner's Guide) (Cluster #4)] [Link to: Understanding the GSC Performance Report: What Your Data Is Really Telling You (Cluster #5)]
Index Coverage Report: Ensuring Google Sees Your Content
You can create perfect content, but if Google doesn't index it, it won't rank. The Index Coverage Report shows exactly which pages Google has indexed, which it hasn't, and why. For a comprehensive walkthrough of diagnosing and fixing indexing issues, see our complete guide to the GSC Index Coverage Report.
The Four Status Categories
Valid: Pages Successfully Indexed
What it means: Google crawled these pages, found no significant issues, and included them in the search index. Subcategories:
- Submitted and indexed: Pages in your sitemap that were successfully indexed
- Indexed, not submitted in sitemap: Pages Google discovered and indexed without sitemap submission What to check:
- Ensure important pages are in "Submitted and indexed"
- Review "Indexed, not submitted" for pages that should be in sitemap or shouldn't be indexed
Valid with Warnings: Indexed but with Issues
What it means: Pages are indexed but have non-critical problems that should be addressed. Common warnings:
- Indexed though blocked by robots.txt: Page is indexed but robots.txt blocks crawling
- Indexed, though blocked by robots.txt: Similar issue, potential future deindexing risk What to do:
- Review robots.txt to ensure you're not accidentally blocking important pages
- Fix blocking if unintentional
- If intentional, consider noindex instead
Error: Pages Not Indexed Due to Errors
What it means: Critical issues preventing indexing. These pages won't appear in search results. Common errors:
- Server error (5xx): Website returned server error when Google tried to crawl
- Redirect error: Page has redirect issue
- 404 not found: Page doesn't exist or returns 404
- Blocked by robots.txt: Robots.txt explicitly blocks Googlebot
- Soft 404: Page returns 200 status but appears to be an error page
- Submitted URL marked 'noindex': Sitemap includes page with noindex tag
- Page with redirect: Page redirects to another URL
- Submitted URL not found (404): Sitemap includes URL that returns 404 Priority: Fix these immediately—they represent lost ranking opportunities. [Screenshot: Index Coverage dashboard showing status categories]
Excluded: Pages Intentionally or Unintentionally Not Indexed
What it means: Google found these pages but chose not to index them, or you explicitly told Google not to. Common exclusions: Intentional exclusions (usually fine):
- Excluded by 'noindex' tag: Page has noindex directive
- Blocked by robots.txt: You're intentionally blocking crawling
- Removed by URL removal tool: You requested temporary removal Unintentional exclusions (need attention):
- Crawled - currently not indexed: Google crawled but decided not to index
- Discovered - currently not crawled: Google found the URL but hasn't crawled it yet
- Duplicate, Google chose different canonical: Page is duplicate, Google indexed a different version
- Alternate page with proper canonical tag: Page properly points to canonical version
- Duplicate without user-selected canonical: Google detected duplicate and chose canonical for you
- Duplicate, submitted URL not selected as canonical: Sitemap includes non-canonical version
- Not found (404): Historical; page used to exist Most concerning: "Crawled - currently not indexed"
- Indicates Google doesn't think page is valuable enough to index
- Common on low-quality, thin, or duplicate content
- Also affects sites with crawl budget constraints [Screenshot: Excluded section showing "Crawled - currently not indexed" detail]
Common Indexing Issues
Server Errors (5xx)
What causes this:
- Website server is down or slow
- Hosting resource limits exceeded
- Database connection issues
- Plugin/module conflicts causing crashes How to fix:
- Check server logs for actual errors
- Test affected URLs directly
- Contact hosting if server problems persist
- Optimize database queries if timeout issues
- Request validation after fixing
Redirect Errors
What causes this:
- Redirect chains
- Redirect loops (A → B → A)
- Redirects to URLs that also redirect
- Too many redirects (>5 in chain) How to fix:
- Identify redirect chains with Screaming Frog or similar tool
- Update redirects to point directly to final destination
- Fix any redirect loops
- Update internal links to avoid redirects entirely
- Request validation
Soft 404s
What causes this:
- Page returns 200 status code but contains no content or error message
- "Product not found" pages returning 200 instead of 404
- Search results pages with no results returning 200
- Thin content pages Google interprets as errors How to fix:
- Ensure actual 404 pages return proper 404 status code
- Add substantial content to thin pages
- Return 404 for truly non-existent content
- Return 410 for permanently removed content
Duplicate Content Issues
What causes this:
- Multiple URLs with identical/similar content
- www vs non-www both accessible
- http and https both accessible
- URL parameters creating duplicates (?id=123)
- Pagination without proper rel=prev/next
- Print versions of pages
- AMP and canonical version conflicts How to fix:
- Implement proper canonical tags pointing to preferred version
- Use 301 redirects to consolidate duplicate URLs
- Configure URL parameters in GSC (legacy tool)
- Block parameter URLs in robots.txt if appropriate
- Ensure www/non-www redirect to one version
- Ensure http redirects to https [Screenshot: Duplicate content issue detail with canonical recommendation]
Crawled But Not Indexed
The most frustrating issue. What causes this:
- Low content quality
- Duplicate or near-duplicate content
- Orphaned pages
- Low crawl priority
- Crawl budget limitations (large sites)
- Recently published content (be patient)
- Low page authority (new site or page) How to fix:
- Improve content quality:
- Add depth and value
- Make content unique
- Address search intent comprehensively
- Build internal links:
- Link from high-authority pages
- Add to navigation if important
- Include in related content sections
- Improve page authority:
- Earn external links
- Update content regularly
- Improve user engagement signals
- Reduce crawl depth:
- Flatten site architecture
- Improve internal linking
- Be patient:
- New content can take weeks to index
- Request indexing via URL Inspection tool
- But don't spam requests When to worry:
- Important pages not indexed after 4+ weeks
- Commercial pages (products, services) not indexing
- Well-linked pages still excluded When it's okay:
- Low-value pages
- Truly duplicate content you don't need indexed
- Very new content (<2 weeks old) [Screenshot: "Crawled - currently not indexed" status with examples]
Prioritizing Index Issues
Not all indexing issues are equally important. Focus on high-impact fixes first. Priority 1 (Fix immediately):
- Server errors on important pages
- Homepage or key landing pages not indexed
- Product/service pages showing errors
- Recent significant increase in errors Priority 2 (Fix this week):
- Redirect errors on linked pages
- Soft 404s on pages that should exist
- Crawled but not indexed on important content
- Submitted URLs marked noindex (unintentionally) Priority 3 (Fix this month):
- Minor duplicate content issues
- Excluded low-priority pages
- Old 404 errors from URLs that never should have existed When "Excluded" is good:
- Thank you pages
- Internal search results pages
- Cart and checkout pages
- Paginated page 2+
- Tag and category pages with thin content
- Admin and account pages [Table: Index issues priority matrix showing severity vs frequency]
The Validation Process
After fixing indexing issues, request validation to tell Google you've resolved them. How validation works:
- You fix the underlying issue
- You click "Validate Fix" in GSC
- Google adds affected URLs to validation queue
- Google recrawls sample URLs immediately
- If sample passes, Google recrawls remaining URLs over time
- Status updates as validation progresses Validation states:
- Not started: You haven't requested validation
- Started: Validation in progress
- Passed: All sampled URLs passed validation
- Failed: Sample URLs still have issues How long validation takes:
- Sample check: Few days
- Complete validation: 2-4 weeks typically
- Large sets: Can take several weeks What if validation fails:
- Review specific URLs that failed
- Test URLs manually to confirm fix
- Verify fix is deployed correctly
- Wait a few days and request validation again
- Check for new issues introduced by fix Pro tips:
- Don't request validation until you've fixed the issue
- One validation request per issue is enough (don't spam)
- Track validation progress in validation history
- If validation fails repeatedly, there may be intermittent issues [Screenshot: Validation workflow and progress states] [Flowchart: Decision tree for addressing index issues] [Link to: How to Read GSC Index Coverage Report (Cluster #17)]
URL Inspection Tool: explore Individual Pages
The URL Inspection Tool is your diagnostic microscope for individual pages. the Index Coverage Report shows site-wide patterns but URL Inspection reveals everything Google knows about a specific URL. For a complete walkthrough of using this powerful tool to diagnose page-level issues, see our GSC URL Inspection Tool guide.
Index Status
Is the page in Google's index?
- URL is on Google: Page is indexed and can appear in search results
- URL is not on Google: Page is not indexed (shows reason why) Last crawl date:
- When Googlebot last accessed this page
- If never crawled, shows "Google hasn't crawled this URL yet" Indexing status:
- Allowed or blocked by robots.txt
- Indexing allowed or blocked by noindex
- Canonical URL
Crawl Information
User agent: Which Googlebot crawled this page
- Smartphone Googlebot
- Desktop Googlebot (rare, mostly legacy) Crawl allowed/disallowed:
- Whether robots.txt permits crawling
- Shows specific robots.txt rule if blocked Page fetch status:
- Success: Page loaded successfully
- Failure: Server error, timeout, etc. Indexing allowed:
- Whether meta robots or X-Robots-Tag allows indexing
- Shows noindex directive if present
Page Resources
Whether JavaScript, CSS, and images loaded:
- Success: All resources accessible to Google
- Failures: Blocked resources Coverage report: Details on which resources loaded or failed
Mobile Usability
Mobile-friendly status:
- Page is mobile-friendly
- Page is not mobile-friendly (shows issues) Mobile usability errors:
- Text too small to read
- Clickable elements too close
- Content wider than screen
- Viewport not set
Rich Results Eligibility
Which rich results this page qualifies for:
- FAQ
- HowTo
- Product
- Recipe
- Event
- Job posting
- etc. Structured data detected:
- Valid structured data found
- Errors or warnings in structured data
Canonical URL
Which URL Google considers canonical:
- User-declared canonical (your canonical tag)
- Google-selected canonical **txt
- noindex? Remove noindex tag
- Canonicalized away? Fix canonical implementation
- Crawl error? Fix server issue
- Run live test to confirm fix
- Request indexing
Problem: Rich Results Not Showing
Diagnostic process:
- Inspect URL
- Scroll to "Enhancements" or "Rich results" section
- Check status:
- Eligible: Structured data valid, may show in search (not guaranteed)
- Errors: Structured data has errors, won't show rich results
- Not detected: No structured data found
- Review specific errors
- Fix structured data
- Test live URL to confirm
- Request indexing
- Rich results may take days/weeks to appear even after fix
Problem: Mobile Usability Issues
Diagnostic process:
- Inspect URL
- Review "Mobile usability" section
- Check specific issues:
- Text too small? Increase font size
- Clickable elements too close? Add spacing
- Content wider than screen? Fix responsive design
- Viewport not set? Add viewport meta tag
- Fix issues
- Test live URL to confirm resolved
- Request indexing to update mobile assessment
Problem: Canonical Issues
Diagnostic process:
- Inspect URL
- Review canonical section
- Compare:
- User-declared canonical: What you specified
- Google-selected canonical: What Google uses
- If they differ:
- Google thinks this is a duplicate
- Google selected different URL as canonical
- Review why Google overrode
- Fix:
- Consolidate duplicate content
- Improve canonicalization signals
- Use 301 redirects if appropriate
- Strengthen internal linking to preferred version [Diagram: URL Inspection troubleshooting workflow] [Link to: GSC URL Inspection Tool: Complete Analysis Guide (Cluster #21)]
Core Web Vitals Report: Page Experience Signals
Core Web Vitals measure real user experience on your pages. Google uses these metrics as ranking signals, making them important for UX and SEO. For a detailed breakdown of what each metric means and how to prioritize improvements, see our comprehensive guide on GSC Core Web Vitals interpretation.
Understanding the Three Vitals
LCP (Largest Contentful Paint)
What it measures: How long it takes for the largest content element to load and become visible. Users perceive pages with fast LCP as loading quickly. What counts as "largest":
- Images
- Video thumbnail
- Background images (via CSS)
- Block-level text elements Thresholds:
- Good: ≤ 2.5 seconds
- Needs Improvement: 2.5 - 4.0 seconds
- Poor: > 4.0 seconds How to improve LCP:
- Optimize images:
- Compress images (WebP format)
- Use responsive images (srcset)
- Lazy load offscreen images
- Preload hero images
- Improve server response time:
- Use faster hosting
- Implement server-side caching
- Use CDN
- Optimize database queries
- Eliminate render-blocking resources:
- Defer non-critical JavaScript
- Inline critical CSS
- Minimize CSS
- Optimize web fonts:
- Use font-display: swap
- Preload key fonts
- Subset fonts (only needed characters)
INP (Interaction to Next Paint)
What it measures: How quickly page responds to user interactions (clicks, taps, keyboard input). Slow INP frustrates users trying to interact with your page. Replaced FID (First Input Delay) in 2024: INP provides more comprehensive interactivity measurement. Thresholds:
- Good: ≤ 200 milliseconds
- Needs Improvement: 200 - 500 milliseconds
- Poor: > 500 milliseconds How to improve INP:
- Minimize JavaScript execution:
- Break up long tasks
- Defer non-essential JavaScript
- Use code splitting
- Remove unused JavaScript
- Optimize event handlers:
- Debounce input handlers
- Use passive event listeners
- Minimize work in handlers
- Reduce main thread work:
- Move processing to Web Workers
- Optimize complex calculations
- Avoid layout thrashing
- Improve server response:
- Faster API responses
- Cache where appropriate
CLS (Cumulative Layout Shift)
What it measures: Visual stability—how much content shifts around unexpectedly while loading. What causes layout shifts:
- Images without dimensions
- Ads, embeds, iframes without reserved space
- Fonts loading and causing text reflow
- Dynamically injected content
- CSS animations triggering layout changes Thresholds:
- Good: ≤ 0.1
- Needs Improvement: 0.1 - 0.25
- Poor: > 0.25 How to improve CLS:
- Set dimensions on images and videos:
- Always include width and height attributes
- CSS aspect-ratio for responsive images
- Reserve space for ads and embeds:
- Set minimum height for ad slots
- Use placeholder for embeds
- Avoid inserting content above existing content:
- Don't inject content that pushes existing content down
- Reserve space for dynamic content
- Optimize font loading:
- Use font-display: optional or swap
- Preload fonts
- Match fallback font metrics
- Avoid animations that trigger layout:
- Use transform and opacity (don't trigger layout)
- Avoid animating width, height, margin, padding [Diagram: Visual explanation of LCP, INP, and CLS with illustrations]
Reading Your Core Web Vitals Data
Good, Needs Improvement, Poor Buckets
GSC categorizes URLs into three buckets for each vital:
- Good: Meets threshold for good user experience
- Needs Improvement: Marginal, should improve
- Poor: Below acceptable threshold URL classification:
- A URL is considered "Poor" if even one vital is poor
- Shows in "Good" only if ALL vitals are good
- "Needs Improvement" if some vitals need improvement but none are poor
Mobile vs Desktop
Core Web Vitals report separates mobile and desktop performance. Why the split:
- Mobile typically performs worse
- Google uses mobile version for ranking
- Users on mobile have different expectations Focus priority:
- Fix mobile first
- Ensure mobile meets "Good" thresholds
- Then address desktop if needed Common patterns:
- Mobile shows issues, desktop is fine → Optimize for mobile specifically
- Both show issues → Fundamental performance problems
- Desktop shows issues, mobile is fine → Unusual, investigate desktop-specific assets
Field Data vs Lab Data
Field data (Real User Monitoring - RUM):
- Actual performance experienced by real users
- Collected from Chrome users who opted in to usage statistics
- What GSC shows
- Reflects real-world conditions
- This is what Google uses for rankings Lab data (Synthetic testing):
- Simulated testing in controlled environment
- Tools: PageSpeed Insights, Lighthouse, WebPageTest
- Consistent testing conditions
- Good for development and debugging
- Not used for rankings, but helpful for finding issues Why they differ:
- Field data varies by actual user conditions
- Lab data uses standard device and network
- Field data may include outliers (very slow devices) Use both:
- Field data (GSC) to understand real user experience
- Lab data (PageSpeed Insights) to diagnose and fix issues
URL-Level vs Aggregate Data
Aggregate view:
- Shows total count of URLs in each bucket
- Trend over time
- Overall site health snapshot URL-level view:
- Specific URLs with issues
- Grouped by similar issues
- Prioritization data How to use:
- Start with aggregate to understand overall status
- Drill into "Poor" URLs
- Review grouped URLs (similar issues)
- Fix issues on example URLs
- Fixes propagate to similar URLs
- Track improvement over time [Screenshot: Core Web Vitals dashboard showing mobile and desktop] [Chart: Threshold breakdown showing good/needs improvement/poor ranges]
Prioritizing Core Web Vitals Fixes
Not all CWV issues impact your rankings equally. High priority:
- Pages with significant traffic in "Poor" status
- Commercial pages
- Mobile issues
- LCP and CLS Medium priority:
- Pages with moderate traffic in "Needs Improvement"
- Blog and informational content
- Desktop issues
- INP improvements Lower priority:
- Low-traffic pages
- Pages passing all vitals but could improve further Impact on rankings: Realistic expectations:
- Core Web Vitals are a ranking signal, but not the strongest
- Content relevance and links matter more
- CWV acts as a tiebreaker between similar pages
- Poor CWV can hold you back from top positions
- Good CWV alone won't make poor content rank User experience correlation:
- Faster pages have lower bounce rates
- Better CLS improves engagement
- Good INP increases interaction rates
- UX improvements often matter more than ranking boost Quick wins vs long-term improvements: Quick wins (implement first):
- Set image dimensions (fixes CLS)
- Optimize images (improves LCP)
- Defer offscreen JavaScript
- Preload critical resources (improves LCP)
- Use font-display: swap Long-term improvements (bigger effort):
- Upgrade hosting/server
- Implement comprehensive caching strategy
- Refactor JavaScript architecture
- Migrate to faster framework
- Implement edge caching with CDN When to hire a developer:
- Complex JavaScript issues causing INP problems
- Server-side optimizations needed
- Architectural changes required
- Multiple vitals in "Poor" after attempting fixes
- Fixes require code refactoring [Screenshot: URL details showing specific Core Web Vitals issues] [Link to: GSC Core Web Vitals Report Interpretation Guide (Cluster #19)]
Mobile Usability Report
With mobile-first indexing, Google primarily uses your mobile page version for ranking. The Mobile Usability Report identifies issues that prevent good mobile experience. To learn how to prioritize and fix these issues systematically, read our guide on mobile usability issues and how to prioritize fixes.
Common Mobile Issues
Text Too Small to Read
The problem: Font size is too small for mobile screens, forcing users to zoom in. Threshold: Text smaller than 12px is flagged How to fix:
- Set minimum font size to 16px for body text
- Use relative units (em, rem) instead of px
- Ensure font scales appropriately across devices
- Test on actual mobile devices CSS example:
body {
font-size: 16px; /* Minimum for readability */
}
Clickable Elements Too Close Together
The problem: Links, buttons, or other tap targets are too close, causing mis-taps. Threshold: Less than 48px between tap targets How to fix:
- Minimum 48px × 48px for touch targets
- Add padding/margin around buttons and links
- Increase spacing in navigation menus
- Test touch interactions on mobile devices CSS example:
button, a {
min-height: 48px;
padding: 12px 16px;
margin: 4px; /* Space between elements */
}
Content Wider Than Screen
The problem: Content extends beyond viewport width, requiring horizontal scrolling. Common causes:
- Fixed-width elements
- Images without max-width
- Tables without responsive styling
- iframe embeds with fixed width How to fix:
- Use responsive width units (%, vw, rem)
- Set
max-width: 100%on images - Make tables scrollable or stack on mobile
- Use responsive embed containers CSS example:
img {
max-width: 100%;
height: auto;
}
.container {
max-width: 100%;
overflow-x: hidden;
}
Viewport Not Set
The problem: Missing or incorrect viewport meta tag causes mobile rendering issues. What viewport tag does:
- Tells browser how to scale page on mobile devices
- Essential for responsive design
- Without it, mobile browsers render at desktop width then scale down
How to fix:
Add viewport meta tag to
<head>:
<meta name="viewport" content="width=device-width, initial-scale=1">
Common mistakes:
maximum-scale=1, user-scalable=no- Wrong syntax or typos
- Missing entirely [Screenshot: Mobile Usability report overview]
Testing and Fixing Mobile Issues
Mobile-Friendly Test Tool
Google provides a dedicated mobile testing tool:
URL: search.google.com/test/mobile-friendly
How to use:
- Enter your URL
- Wait for test to complete
- Review results:
- "Page is mobile-friendly" → ✓ Good
- "Page is not mobile-friendly" → Issues listed
- Fix identified issues
- Retest Advantages:
- Tests any URL (even not in GSC)
- Provides screenshot of how Google renders page
- Shows specific issues found
- No GSC access required
Using Browser Dev Tools
Chrome DevTools provides powerful mobile testing capabilities. How to test:
- Open page in Chrome
- Press F12 (or right-click → Inspect)
- Click device toggle icon (or Ctrl+Shift+M)
- Select device preset or set custom dimensions
- Test touch interactions and scrolling
- Use throttling to simulate slow connections What to test:
- Tap target sizes
- Text readability at actual size (no zooming)
- Horizontal scrolling (shouldn't exist)
- Navigation usability
- Form input experience
- Load time on slow connection (use throttling)
Testing Across Real Devices
Simulator testing is good, but real device testing is essential. Minimum test devices:
- iPhone
- Android phone
- Older Android What to test:
- Touch interactions feel natural
- Text is comfortably readable
- Page loads at acceptable speed
- Forms are easy to complete
- Navigation is intuitive Device cloud services:
- BrowserStack
- Sauce Labs
- LambdaTest
Validation Process
Inspect URL in GSC URL Inspection tool 4. Run live test to confirm mobile-friendly status 5. Click "Validate Fix" in Mobile Usability report 6. Wait for validation (days to weeks) 7. Track validation progress 8. Issues should disappear from report once validated Timeline:
- Fixes go live → Immediate
- Test confirms fix → Minutes
- Google recrawls → Days to weeks
- Validation completes → Weeks
- Report updates → After validation [Screenshot: Mobile usability errors with examples] [Before/after: Mobile issue fixed comparison] [Link to: Mobile Usability Issues: How to Prioritize Fixes (Cluster #20)]
Enhancements: Rich Results and Structured Data {#enhancements-rich-results}
Rich results make your search listings stand out with additional visual elements—ratings, images, FAQs, pricing, and more. The Enhancements section shows which rich results you're eligible for and tracks their performance.
Types of Rich Results
FAQ Schema
What it is: Displays frequently asked questions directly in search results Eligibility requirements:
- Valid FAQ structured data
- Questions and answers format
- At least 2 FAQ items
- Content matches page content Impact:
- Significantly increases SERP real estate
- Can push competitors down
- Improves CTR by 20-40% on average
- Provides immediate value to searchers Example use cases:
- FAQ pages
- Product pages with common questions
- Blog posts answering multiple related questions [Screenshot: FAQ rich results in search results]
HowTo Schema
What it is: Displays step-by-step instructions in search results Eligibility requirements:
- Valid HowTo structured data
- Minimum 2 steps
- Each step has descriptive text
- Steps lead to actionable outcome Impact:
- Appears for "how to" queries
- Shows visual step guide
- Improves visibility for tutorial content
- Can include images for each step Example use cases:
- Tutorial articles
- Recipe instructions
- DIY guides
- Installation instructions
Product Schema
What it is: Displays product information like price, availability, ratings Eligibility requirements:
- Valid Product structured data
- Price and currency
- Availability status
- Product name and image Optional but recommended:
- Aggregate rating (star display)
- Review count
- Brand Impact:
- Shows price and availability in search
- Star ratings improve CTR dramatically (30-50% lift)
- Essential for e-commerce SEO
- Appears in Google Shopping results (free listings) Example use cases:
- Product pages
- E-commerce listings
- Service offerings with pricing
Recipe Schema
What it is: Displays cooking time, ratings, calories for recipes Eligibility requirements:
- Valid Recipe structured data
- Recipe name and image
- Ingredients list
- Instructions Optional but recommended:
- Prep time, cook time
- Nutrition information
- Ratings and reviews
- Recipe category Impact:
- Appears in recipe search features
- Shows in Google Images
- Dedicated recipe carousel
- Critical for food blogs Example use cases:
- Recipe blog posts
- Cooking tutorials
- Food websites
Event Schema
What it is: Displays event details like date, location, price Eligibility requirements:
- Valid Event structured data
- Event name
- Start date and time
- Location (physical or virtual) Optional:
- End date/time
- Ticket price and availability
- Organizer information
- Image Impact:
- Appears in event searches
- Shows in Google Events experience
- Local discovery
- Important for event promotion Example use cases:
- Conference pages
- Concert and show listings
- Webinar announcements
- Local event pages
Review Schema
What it is: Displays ratings and review information Eligibility requirements:
- Valid Review structured data
- Item being reviewed
- Rating value
- Author name Google's restrictions:
- Can't be self-reviews (your own business)
- Must be independent reviews
- Editorial reviews only Impact:
- Star ratings in search results
- Increases CTR significantly
- Trust signals
- Competitive advantage Example use cases:
- Product reviews
- Service reviews
- Book/movie reviews
- Software comparisons [Examples: Different rich result types in SERPs]
Monitoring Rich Result Performance
The Enhancements section tracks rich results separately. What you can see: Per enhancement type:
- Total impressions for pages with this enhancement
- Total clicks
- CTR
- Valid pages count
- Error pages count
- Warning pages count URL-level details:
- Which specific pages have this enhancement
- Issues preventing rich results
- Validation status
- Examples of detected structured data How to analyze: Compare CTR with and without rich results:
- Note CTR for pages with FAQ schema
- Compare to similar pages without schema
- Calculate CTR lift from implementation
- Use for ROI calculation of schema efforts Track rich result impressions:
- Monitor trend over time
- Increasing impressions = more rich result appearances
- Decreasing = potential issues or algorithm changes Identify errors:
- Review error and warning counts
- Click into specific errors
- See which pages affected
- Fix structured data issues
- Validate fixes Common errors: FAQ schema:
- Duplicate questions
- Question doesn't have answer
- Answer too short
- Invalid markup syntax Product schema:
- Missing price or availability
- Invalid price format
- Missing required properties
- Review schema issues (if included) HowTo schema:
- Too few steps (minimum 2)
- Steps don't form coherent instruction
- Missing step descriptions
- Invalid image URLs Recipe schema:
- Missing required ingredients or steps
- Invalid time format
- Nutrition values in wrong format [Screenshot: Enhancements section overview showing different types] [Screenshot: FAQ rich results performance data]
Testing Structured Data
Before deployment and after fixes, test your structured data: Rich Results Test:
- URL:
search.google.com/test/rich-results - Tests if page is eligible for rich results
- Shows detected structured data
- Identifies errors and warnings
- Provides code view of detected schema Schema Markup Validator:
- URL:
validator.schema.org - Validates schema syntax
- Comprehensive error detection
- Supports all schema types
- Technical validation Testing workflow:
- Add structured data to page
- Test with Rich Results Test
- Fix any errors shown
- Validate with Schema Validator
- Deploy to live site
- Inspect URL in GSC
- Check if structured data detected
- Request indexing
- Monitor Enhancements report for appearance Timeline for rich results to appear:
- Structured data deployed → Immediate
- Google detects (inspect URL) → Hours to days
- Appears in Enhancements report → Days to week
- Shows in actual search results → Days to weeks (not guaranteed)
- Performance data appears → After rich results show in search
- Query relevance
- Schema quality and accuracy
- Content quality
- User intent
- SERP composition
- Testing and algorithmic factors [Link to: Search Appearance in GSC: Understanding Rich Results Impact (Cluster #11)]
Security & Manual Actions {#security-manual-actions}
The Security and Manual Actions sections alert you to serious issues that can remove your site from search results entirely.
Security Issues
Google monitors sites for security problems that could harm searchers. Types of security issues:
Hacked Content
What it is: Your site was compromised and now contains injected content Common hacking types:
- Japanese keyword hack
- Pharmaceutical hack (spam about pills)
- Cloaking hack
- Redirect hack How you'll know:
- Security Issues panel shows alert
- Email notification (if enabled)
- Search results may show "This site may be hacked" warning
- Significant drop in traffic How to fix:
- Identify how site was hacked
- Clean up hacked content
- Update all software, plugins, themes
- Change all passwords
- Review file permissions
- Implement security measures
- Request review in GSC
Malware
What it is: Your site attempts to install malicious software on visitors' devices Signs:
- Browser warnings on your site
- "This site ahead contains malware" message
- Sudden traffic drop
- Security alert in GSC How to fix:
- Scan entire website for malware
- Remove malicious code
- Identify entry point (how malware was installed)
- Update security measures
- Scan server environment
- Request review in GSC
Phishing
What it is: Your site attempts to trick users into providing sensitive information Examples:
- Fake login pages
- Impersonating another website
- Social engineering attacks How to fix:
- Remove all phishing content
- Identify how content was added (hacked vs intentional)
- Ensure no legitimate pages could be misconstrued as phishing
- Request review in GSC Prevention tactics: Basic security:
- Keep all software updated
- Use strong, unique passwords
- Enable two-factor authentication
- Use secure hosting
- Implement HTTPS
- Regular security audits Advanced security:
- Web Application Firewall (WAF)
- Security monitoring service
- Regular malware scanning
- File integrity monitoring
- Limited file permissions
- Disable file editing in CMS admin [Screenshot: Security Issues panel showing clean status]
Manual Actions
Manual actions are penalties applied by human reviewers at Google for violating Google's Webmaster Guidelines. What triggers manual actions:
Thin Content with Little or No Value
Examples:
- Auto-generated content
- Scraped content from other sites
- Doorway pages
- Pages with little useful content Impact: Specific pages or entire site demoted in rankings
User-Generated Spam
Examples:
- Spammy forum posts
- Comment spam
- Spammy user profiles Impact: Affected sections demoted How to fix: Moderate user content, remove spam, implement better spam filtering
Unnatural Links to Your Site
Examples:
- Purchased links
- Link schemes
- Low-quality directory links
- Spam blog links Impact: Entire site or specific pages demoted How to fix:
- Review backlink profile
- Identify unnatural links
- Contact sites to remove links
- Disavow links you can't remove
- Document cleanup efforts
- Submit reconsideration request
Unnatural Links from Your Site
Examples:
- Selling links
- Linking to link schemes
- Excessive link exchanges Impact: PageRank stopped from flowing through these links How to fix:
- Remove or nofollow unnatural outbound links
- Stop link schemes
- Submit reconsideration request
Cloaking or Sneaky Redirects
Examples:
- Showing different content to Google vs users
- Redirecting users to different page than Googlebot sees
- Mobile cloaking Impact: Page or site removed from index How to fix:
- Remove cloaking
- Ensure same content shown to all users and Google
- Fix redirects to be user-focused
- Request reconsideration
Pure Spam
Examples:
- Automatically generated gibberish
- Scraper sites
- Sites dedicated to spam Impact: Site removed from search index How to fix: Completely rebuild site with genuine, quality content [Screenshot: Manual Actions panel showing clean status] [Example: Manual action notification - anonymized]
How to Resolve and Request Reconsideration
Fix all violations:**
- Remove/fix all violating content
- Document what you changed
- Ensure underlying practices changed 4. Submit reconsideration request:
- In Manual Actions panel, click "Request Review"
- Explain what you found
- Describe how you fixed it
- Provide evidence of changes
- Be honest and thorough 5. Wait for review:
- Typically 1-3 weeks
- Could be faster or slower
- Don't resubmit immediately if denied 6. If request is denied:
- Read the denial explanation
- Identify what you missed
- Fix additional issues
- Submit new request Timeline:
- Fix issues → As long as it takes
- Submit request → Same day after fixes complete
- Google reviews → 1-3 weeks typically
- Manual action lifted → Immediately upon approval
- Rankings recover → Days to weeks after lift
Links Report: Understanding Your Backlink Profile {#links-report}
Links remain a top ranking factors. The Links report shows your backlink profile and internal linking structure.
External Links Analysis
What GSC shows:
Top Linking Sites
Sorted by number of links from each domain:
- Which domains link to you most
- Link count from each domain
- Example target URLs How to use:
- Identify your strongest link sources
- Nurture relationships with top linkers
- Analyze what content attracts links
- Look for patterns in linking domains What to look for:
- Quality domains: Reputable sites in your niche
- Spam domains: Low-quality or suspicious sites (consider disavow)
- Lost opportunities: Sites that should link but don't
- Unexpected linkers: Discover new partnership opportunities
Top Linked Pages
Your pages receiving most backlinks:
- Internal ranking of link popularity
- Shows which content attracts links naturally
- Identifies link magnets How to use:
- Analyze what makes top-linked pages successful
- Create more content with similar link-worthy qualities
- Update top-linked pages to maintain value
- Link internally from these pages to spread authority Patterns to look for:
- Original research attracts links
- Comprehensive guides attract links
- Free tools attract links
- Visual content (infographics) attracts links
- Data and statistics attract links
Link Text (Anchor Text)
Most common anchor text pointing to your site:
- Shows how others describe your site
- Indicates topical relevance signals
- Can reveal over-optimization How to analyze:
- Check if branded anchors dominate (good sign)
- Look for natural variation (healthy)
- Identify exact-match keyword anchors
- Note generic anchors ("click here," URLs) Healthy anchor text profile:
- 40-60% branded anchors
- 20-30% partial match / related terms
- 10-20% generic anchors
- 10-20% naked URLs
- <10% exact match keywords Red flags:
- Majority exact-match keywords (unnatural)
- Repetitive identical anchors
- Foreign language spam anchors
- Commercial keywords for every link [Screenshot: External links top linking sites]
Internal Links Analysis
What GSC shows:
Most Linked Pages
Pages with most internal links pointing to them:
- Shows your internal linking priorities
- Indicates site structure hierarchy
- Reveals which pages you're pushing Expected pattern:
- Homepage typically has most internal links
- Main category pages high in list
- Important landing pages well-linked
- Service/product pages linked from multiple places What to check:
- Are your most important pages well-linked?
- Are orphan pages (0 internal links) showing?
- Do old, less important pages have more links than key pages?
- Is link distribution aligned with business priorities?
Link Text
Internal anchor text distribution:
- How you describe your own pages
- Indicates topical relevance
- Shows navigational structure Best practices:
- Descriptive anchor text (not "click here")
- Keyword-relevant where natural
- Varied anchors to same page
- Navigation-focused for menus
- Content-focused for contextual links How to improve internal linking:
- Identify important pages with few internal links
- Find contextually relevant places to add links
- Use descriptive anchor text
- Link from high-authority pages to newer pages
- Create hub pages that link to related content
- Add related content sections to blog posts [Screenshot: Internal links report showing most linked pages]
Experience Report: Aggregated Page Experience {#experience-report}
The Experience Report provides a holistic view of page experience across your site.
Core Web Vitals
- Mobile and desktop performance
- Aggregate of LCP, INP, CLS
- Links to detailed Core Web Vitals report
HTTPS Usage
Status:
- All pages served over HTTPS ✓
- Some pages not HTTPS
- No HTTPS (major problem) Why it matters:
- HTTPS is a ranking signal
- Essential for security and trust
- Required for many modern web features
- Browser warnings on non-HTTPS sites How to fix if not using HTTPS:
- Purchase SSL certificate (or use free Let's Encrypt)
- Install certificate on server
- Update all internal links to HTTPS
- Redirect HTTP to HTTPS via 301 redirects
- Update canonical tags to HTTPS
- Update sitemap to HTTPS URLs
- Monitor for mixed content warnings
Mobile Usability
- Count of mobile-friendly pages
- Count of pages with mobile issues
- Links to Mobile Usability report for details
Safe Browsing Status
Checks for:
- Malware
- Deceptive content
- Harmful downloads
- Uncommon downloads Status:
- No issues detected (normal)
- Issues found
Intrusive Interstitial Issues
What Google checks:
- Pop-ups that cover main content immediately on load
- Standalone interstitials that must be dismissed
- Layouts where above-the-fold looks like interstitial Allowed interstitials:
- Legal requirements
- Login dialogs for private content
- Banners using reasonable screen space (<15% on mobile)
- Exit-intent interstitials How to fix intrusive interstitials:
- Remove pop-ups that appear immediately on mobile
- Delay pop-ups until user has engaged with content
- Use slide-ins or banners instead of full-screen overlays
- Implement exit-intent technology
- Ensure dismissal is easy (large X button) [Screenshot: Experience report dashboard showing all components]
Interpreting Experience Scores
How Google calculates experience: Google combines all page experience signals to evaluate overall user experience: Positive signals:
- Good Core Web Vitals (LCP, INP, CLS)
- Mobile-friendly
- HTTPS
- No intrusive interstitials
- Safe browsing (no malware/phishing) Negative signals:
- Poor Core Web Vitals
- Not mobile-friendly
- HTTP (not HTTPS)
- Intrusive pop-ups
- Security issues The calculation:
- Not a simple score
- All factors considered together
- Some factors weigh more than others
- Mobile experience prioritized
Correlation with Rankings
Realistic expectations: Page experience IS a ranking factor, but:
- Content relevance matters more
- Quality backlinks matter more
- Page experience acts as a tiebreaker
- Excellent UX won't overcome irrelevant content
- Poor UX can prevent great content from ranking at its potential Where it matters most:
- Competitive SERPs
- Commercial queries
- Mobile searches
- Broad informational queries Where it matters less:
- Branded searches
- Unique expert content
- Very specific long-tail queries
Setting Improvement Goals
Prioritization framework: Must-fix (immediate priority):
- HTTP sites → Migrate to HTTPS
- Not mobile-friendly → Implement responsive design
- Security issues → Clean and secure site
- Poor Core Web Vitals on high-traffic pages → Optimize performance Should-fix (high priority):
- Needs Improvement Core Web Vitals → Optimize to Good
- Intrusive interstitials → Adjust or remove
- Some mobile usability issues → Fix affected templates Nice-to-fix (lower priority):
- Good Core Web Vitals → Optimize further for better UX (not ranking boost)
- Minor mobile usability issues on low-traffic pages Realistic improvement timeline: Quick wins (1-2 weeks):
- Fix intrusive interstitials
- Set image dimensions (CLS fix)
- Implement HTTPS (if hosted properly) Medium effort (1-2 months):
- Improve Core Web Vitals to Good
- Fix most mobile usability issues
- Optimize major templates Long-term (3-6 months):
- Comprehensive performance optimization
- Site-wide mobile experience improvements
- Advanced technical optimizations Tracking improvement:
- Baseline: Record current Experience Report status
- Set specific goals
- Implement fixes
- Monitor weekly/monthly
- Adjust strategy based on progress
- Correlate improvements with traffic/ranking changes
Sitemaps Section: Keeping Google Updated {#sitemaps-section}
XML sitemaps tell Google which pages exist on your site and how they're organized, making crawling and indexing more efficient.
Submitting Your Sitemap
What is an XML sitemap:
- File listing all important URLs on your site
- Includes metadata: last modified date, change frequency, priority
- Helps Google discover pages, especially:
- New sites
- Large sites
- Sites with poor internal linking
- Sites with isolated page groups Sitemap best practices: What to include:
- All indexable pages
- Important, high-quality content
- Recently published content
- Updated content What NOT to include:
- Pages blocked by robots.txt
- Pages with noindex tags
- Duplicate content pages
- Low-quality pages you don't want indexed
- Redirect URLs
- Error pages (404, 5xx) Sitemap size limits:
- Maximum 50,000 URLs per sitemap file
- Maximum 50MB uncompressed
- Use sitemap index file if you exceed limits [Screenshot: Sitemaps submission panel]
Sitemap Index Files
For large sites, use a sitemap index that references multiple sitemaps. Structure:
<?xml version="1.0" encoding="UTF-8"?>
<sitemapindex xmlns="http://www.sitemaps.org/schemas/sitemap/0.9">
<sitemap>
<loc>https://www.example.com/sitemap-posts.xml</loc>
<lastmod>2026-01-21</lastmod>
</sitemap>
<sitemap>
<loc>https://www.example.com/sitemap-pages.xml</loc>
<lastmod>2026-01-21</lastmod>
</sitemap>
<sitemap>
<loc>https://www.example.com/sitemap-products.xml</loc>
<lastmod>2026-01-21</lastmod>
</sitemap>
</sitemapindex>
When to use:
- More than 50,000 URLs
- Organizing by content type
- Large e-commerce sites
- Multi-language sites How to organize:
- By content type
- By update frequency
- By language or region
- Whatever makes logical sense for your site
How Often Google Crawls Sitemaps
Depends on:
- Site authority and trust
- Crawl budget allocated to your site
- How often sitemap changes
- Historical update patterns Typical patterns:
- High-authority sites: Multiple times per day
- Medium sites: Daily to weekly
- New/small sites: Weekly to monthly
- Rarely-updated sites: Less frequently How to signal updates:
- Update
<lastmod>date in sitemap - Ping Google:
https://www.google.com/ping?sitemap=https://example.com/sitemap.xml - Resubmit in GSC
Sitemap Report Insights
After submitting a sitemap, GSC provides insights: Status:
- Success: Sitemap processed successfully
- Couldn't fetch: Google can't access sitemap
- Errors: Problems with sitemap format or content Metrics:
Discovered URLs
- Total URLs listed in sitemap
- Shows Google read your sitemap
Indexed URLs
Critical metric: How many of your submitted URLs are indexed Comparison:
- Discovered = Indexed: Perfect
- Discovered > Indexed: Common; some URLs not deemed worthy of indexing
- Indexed > Discovered: You're indexed for more than you submitted Why discovered URLs might not be indexed:
- Low quality content
- Duplicate content
- Crawl budget constraints
- Recent additions (not yet crawled)
- Noindex tags
- Pages blocked by other means [Screenshot: Sitemap status and coverage showing discovered vs indexed]
Sitemap Errors and How to Fix Them
Common errors:
HTTP Error (Sitemap Can't Be Read)
Causes:
- 404 error
- Server error (5xx)
- Robots.txt blocks sitemap
- Firewall blocks Googlebot How to fix:
- Verify sitemap exists at submitted URL
- Test URL in browser
- Check robots.txt doesn't block sitemap path
- Review server logs for errors
- Ensure Googlebot can access
XML Parsing Error
Causes:
- Invalid XML syntax
- Missing closing tags
- Improper escaping of URLs
- Incorrect encoding How to fix:
- Validate sitemap XML with sitemap validator
- Fix syntax errors
- Ensure proper XML formatting
- Escape special characters in URLs (&, <, >, etc.)
- Save with UTF-8 encoding
Unsupported Format
Causes:
- Not proper XML format
- Wrong namespace declaration
- Invalid sitemap structure How to fix:
- Use proper sitemap XML structure
- Include correct namespace:
xmlns="http://www.sitemaps.org/schemas/sitemap/0.9" - Follow sitemap protocol specification
Incorrect Namespace
Cause: Wrong XML namespace in sitemap How to fix: Use correct namespace:
<urlset xmlns="http://www.sitemaps.org/schemas/sitemap/0.9">
Thumbnail Too Large
For video sitemaps: Cause: Video thumbnail exceeds size limit How to fix:
- Resize thumbnail to maximum 160×120px
- Compress image
- Update sitemap with new thumbnail URL
When to Update Your Sitemap
Update sitemap when:
- Publishing new content
- Deleting/removing pages
- Changing URL structure
- Updating significant content
- Launching new site sections How often:
- News sites.
When to Use Removals
Appropriate use cases:
Urgent Temporary Removal
- Accidentally published private information
- Leaked confidential data
- Personal information that shouldn't be public
- Legal requirement for immediate removal (DMCA, court order)
- Security-sensitive information exposed
Outdated Content
- Page no longer exists but cached version still appears
- Content removed from site but still showing in search
- Outdated information causing harm Removals are temporary (6 months). For permanent removal, use proper methods (404, noindex, robots.txt).
Removal Types
Temporary Removals (6 Months)
What it does:
- Removes URL from Google Search for ~6 months
- Removes from search results
- Clears cached version
- Affects all Google Search properties When to use:
- Urgent privacy issues
- Sensitive data accidentally exposed
- Immediate removal needed while implementing permanent solution How to request:
- Go to Removals section in GSC
- Click "New Request"
- Select "Temporarily remove URL from Google Search"
- Enter URL (exact match or prefix)
- Submit request Processing time:
- Usually processed within 24-48 hours
- Can be as fast as a few hours
- Check status in Removals report
- This is temporary
- Implement permanent removal method before expiration
- Doesn't prevent re-indexing if page still accessible and indexable
Outdated Content Removal
What it does:
- Clears cached version of content that no longer exists
- Removes snippet from search results
- Only works if content changed or removed on your site When to use:
- Page content changed significantly
- Content removed from page
- Cached version shows outdated information
- Page deleted (returns 404/410) How to request:
- Removals → New Request
- Select "Clear cached URL"
- Enter URL
- Submit Requirements:
- Content must be gone or changed on your site
- If content still exists unchanged, request will be denied
SafeSearch Filtering
What it does:
- Flags URL to be filtered when SafeSearch is enabled
- Removes from search for users with SafeSearch active When to use:
- Adult content that should be filtered
- Explicit material
- Content inappropriate for minors How to request:
- Removals → New Request
- Select "Filter explicit content"
- Enter URL
- Submit [Screenshot: Removals tool interface showing request types]
Removal Limitations
What removals CAN'T do: Can't permanently remove content:
- Temporary removal expires after 6 months
- Use 404, 410, noindex, or robots.txt for permanent removal Can't remove from other search engines:
- Only affects Google Search
- Bing, DuckDuckGo, etc. not affected
- Need to use their respective tools Can't remove if content still exists:
- Outdated content removal requires content to be gone
- If content unchanged, removal denied Can't remove other people's content:
- Only works for sites you verified in GSC
- For removing content on other sites, use legal removal requests Can't undo algorithmic action:
- Removals don't fix manual actions or algorithm issues
- Address root cause instead
Permanent Removal Alternatives
For true permanent removal, use these methods:
404 or 410 Status Code
Best for: Content you want completely gone How:
- Delete page (returns 404)
- Or return 410 (permanently gone)
- Google will eventually deindex Timeline: Days to weeks for complete removal from index
Noindex Tag
Best for: Pages you want to keep but not have indexed
How:
Add to <head>:
<meta name="robots" content="noindex">
Or HTTP header:
X-Robots-Tag: noindex
Timeline: Googlebot must recrawl to see noindex, then removes from index (days to weeks)
Robots.txt Blocking
Best for: Preventing future crawling How:
User-agent: *
Disallow: /private/
Password Protection
Best for: Private content that shouldn't be accessible How:
- Require login to access
- Google can't crawl, won't index
- Immediate and permanent Comparison: | Method | Speed | Permanence | Use Case | |--------|-------|------------|----------| | GSC Removal | Hours-days | 6 months | Urgent temporary | | 404/410 | Days-weeks | Permanent | Deleted content | | Noindex | Days-weeks | Permanent | Keep page, don't index | | Robots.txt | Prevents crawling | Permanent | Block sections | | Password | Immediate | Permanent | Truly private | Recommended approach:
- Immediate: Request removal via GSC Removals tool
- Same day: Implement permanent solution (404, noindex, etc.)
- Monitor: Ensure permanent solution working before 6-month expiration
Crawl Stats Report: Understanding Googlebot Activity {#crawl-stats-report}
The Crawl Stats Report shows how Googlebot interacts with your server, revealing crawl patterns and potential issues. Understanding what's normal versus problematic can help you identify technical issues early. For detailed guidance on interpreting these patterns, see our complete GSC Crawl Stats guide on normal vs problematic patterns.
Key Crawl Metrics
Total Crawl Requests
What it measures: Number of requests Googlebot made to your site Includes:
- Page requests
- CSS requests
- JavaScript requests
- Image requests
- Other resource requests What's normal:
- Varies dramatically by site size
- Small sites: Dozens to hundreds per day
- Medium sites: Hundreds to thousands per day
- Large sites: Thousands to millions per day Trends to watch:
- Gradual increase: Normal as site grows
- Sudden increase: Could be new content, improved crawl efficiency, or issues
- Sudden decrease: Potential problem
Total Download Size
What it measures: Bandwidth consumed by Googlebot crawling your site Typical values:
- Varies by site size and content type
- Image-heavy sites: More bandwidth
- Text-heavy sites: Less bandwidth Why it matters:
- Hosting bandwidth limits
- Server load considerations
- CDN cost (if applicable) How to reduce if needed:
- Optimize images
- Minify CSS/JavaScript
- Use compression (gzip, brotli)
- Implement efficient caching
Average Response Time
What it measures: How quickly your server responds to Googlebot requests Good values:
- < 200ms: Excellent
- 200-500ms: Good
- 500-1000ms: Fair
- > 1000ms: Slow (potential issue) Why it matters:
- Affects crawl rate
- Indicates server performance
- Impacts user experience How to improve:
- Upgrade hosting
- Implement caching
- Optimize database queries
- Use CDN
- Reduce server processing [Screenshot: Crawl stats dashboard showing all three metrics]
Reading Crawl Patterns
Normal Crawl Rate Fluctuations
What's normal:
- Day-to-day variations (±20-30%)
- Weekly patterns (weekday vs weekend)
- Seasonal changes
- Gradual trends up or down Why fluctuations happen:
- Google's crawl budget allocation changes
- Your content publishing frequency
- Server performance variations
- Google's crawling priorities shift
- Major updates to site Not concerning:
- Small daily variations
- Temporary dips or spikes
- Gradual increases as site grows
Crawl Budget Considerations
What is crawl budget:
- How many pages Google is willing to crawl on your site in a given time
- Limited resource Google allocates based on site authority, update frequency, server capacity Who should care about crawl budget:
- Large sites (10,000+ pages)
- E-commerce sites with frequent inventory changes
- News sites with rapid publishing
- Sites with infinite scroll or faceted navigation Who shouldn't worry:
- Small sites (<10,000 pages)
- Sites publishing infrequently
- New sites How to optimize crawl budget:
- Fix crawl errors: Don't waste budget on broken pages
- Use robots.txt wisely: Block low-value pages
- Improve server speed: Faster responses = more pages crawled
- Update sitemap frequently: Prioritize new/updated content
- Reduce duplicate content: Don't let Google waste budget on duplicates
- Manage URL parameters: Configure in GSC settings (legacy)
- Fix redirect chains: Direct redirects only [Chart: Normal crawl rate pattern showing acceptable fluctuation ranges]
When to Be Concerned About Crawl Stats
Red flags:
Sudden Significant Drop (>50%)
Possible causes:
- Server issues
- Robots.txt accidentally blocking Googlebot
- Manual action applied
- Site moved/migrated with issues
- DNS problems What to do:
- Check server uptime and performance
- Review robots.txt for accidental blocks
- Check Manual Actions report
- Review Index Coverage for errors
- Test site accessibility from different locations
Consistent 404 or 5xx Errors
If crawl requests frequently encounter errors: Impact:
- Reduces crawl rate
- Pages not indexed
- Rankings decline What to do:
- Review Index Coverage Report for error details
- Fix server issues causing 5xx errors
- Fix or redirect 404 errors
- Monitor server logs for error patterns
Unusually High Crawl Rate
If crawl rate suddenly spikes dramatically: Possible causes:
- Recent site update or launch
- Google re-evaluating your site
- Accidentally exposed new URLs
- Hacker adding spam pages Concerns:
- Server overload
- Hosting bandwidth costs
- Performance degradation for users What to do:
- Check server load/performance
- Review recently indexed pages for spam
- Use robots.txt to block unnecessary crawling
- Configure URL parameters if applicable
- Request temporary crawl rate reduction
High Response Times
If average response time consistently high or increasing: Impact:
- Reduced crawl rate
- Worse user experience
- Potential ranking impact What to do:
- Analyze server performance
- Check for database bottlenecks
- Implement caching
- Optimize slow queries
- Consider hosting upgrade
Server Load Correlation
Monitor:
- Correlation between Googlebot crawl times and server load
- Peak crawl times vs peak traffic times
- Impact on real user experience If Googlebot impacts real users:
- Upgrade server resources
- Implement more aggressive caching
- Use CDN for static resources
- Optimize server efficiency
- In extreme cases, request crawl rate limit (last resort) How to request crawl rate reduction:
- In legacy GSC settings
- Only reduce if absolutely necessary
- Google may not honor request if they deem your server capable [Link to: Understanding GSC Crawl Stats: What's Normal vs Problematic (Cluster #18)]
Settings & Users: Managing Your Property {#settings-users}
The Settings section handles administrative tasks and property configuration.
Property Settings
International Targeting
Only available for URL prefix properties (not domain properties) What it does:
- Signals which country your site targets
- Influences which country's search results you appear in When to use:
- Generic TLD (.com, .org, .net) targeting specific country
- Site in English targeting Canada (not US)
- Want to specify primary country When NOT needed:
- Using country-specific TLD (.co.uk, .de, .fr) – already signals country
- Domain property (not available)
- Truly international site targeting all countries How to set:
- Settings → International targeting
- Select target country
- Save
Address Changes
For site migrations and domain changes What it does:
- Tells Google you moved to new domain
- Helps transfer ranking signals
- Expedites indexing of new domain When to use:
- Moving from old-domain.com to new-domain.com
- Rebranding with new domain
- Migrating from subdomain to main domain (or vice versa) Requirements:
- Set up 301 redirects from old to new domain
- Verify old and new properties in GSC
- Submit change of address request How to do it:
- Verify old and new properties in GSC
- Set up 301 redirects (all old URLs → new URLs)
- In old property: Settings → Change of address
- Select new property
- Submit request
- Google validates and processes
- Keep old property verified and redirects in place for at least 180 days
- Monitor both properties during transition
- Update all external links where possible
Parameter Handling (Legacy)
What it does:
- Tells Google how to handle URL parameters
- Prevents duplicate content from parameters
- Manages crawl budget Common parameters:
- Tracking:
?utm_source=facebook - Sorting:
?sort=price-asc - Filtering:
?color=red&size=large - Session IDs:
?sessionid=abc123How to configure:
- Legacy Settings → URL Parameters
- Add parameter
- Specify effect:
- No effect
- Changes content (creates unique page)
- Sorts
- Filters
- Translates
- Paginates
- Tell Google how to crawl: Every URL or Representative URL Modern alternative:
- Use canonical tags on parameter URLs pointing to clean URL
- Block parameter URLs in robots.txt if truly unnecessary
Associations
Connect GSC to other Google properties: Google Analytics:
- See GSC data in GA4
- Combined analysis
- Unified reporting How to associate:
- Settings → Associations
- Find Google Analytics
- Click Associate
- Select GA4 property
- Confirm Google Ads:
- See organic search data in Google Ads
- Understand organic vs paid performance Merchant Center:
- For e-commerce sites using Google Shopping
- Product data integration [Screenshot: Settings panel with key options highlighted]
User Management
Permission Levels
Owner (Full permissions):
- Add/remove other users (including owners)
- Manage all property settings
- Request site removal
- View all data
- Take all actions When to assign: Site owner, primary administrator Full User:
- View all data
- Take most actions
- Cannot add/remove users
- Cannot delete property When to assign: SEO managers, developers, agencies with full access needs Restricted User:
- View most data
- Cannot take actions
- Read-only When to assign: Analysts, report viewers, clients who need visibility Permission comparison: | Capability | Owner | Full User | Restricted User | |------------|-------|-----------|-----------------| | View performance data | ✓ | ✓ | ✓ | | View index data | ✓ | ✓ | ✓ | | Request indexing | ✓ | ✓ | ✗ | | Submit sitemaps | ✓ | ✓ | ✗ | | Request removals | ✓ | ✓ | ✗ | | Disavow links | ✓ | ✓ | ✗ | | Add/remove users | ✓ | ✗ | ✗ | | Delete property | ✓ | ✗ | ✗ | [Screenshot: Users and permissions panel]
Adding and Removing Users
How to add users:
- Settings → Users and permissions
- Click "Add user"
- Enter Google account email address
- Select permission level
- Click Add
- User receives email notification with access How to remove users:
- Settings → Users and permissions
- Find user in list
- Click three-dot menu
- Select "Remove access"
- Confirm removal How to change permission level:
- Settings → Users and permissions
- Find user
- Click current permission level
- Select new level
- Save
Security Best Practices
Maintain access security: 1. Have multiple owners:
- Never have only one owner (prevents lockout)
- Minimum 2-3 owner accounts
- Use different email domains if possible 2. Use Full User for agencies:
- Don't give agency Owner access
- Full User provides enough permissions for work
- You retain ultimate control 3. Audit users quarterly:
- Review who has access
- Remove former employees
- Downgrade permissions when appropriate
- Document why each person has access 4. Use organizational emails:
- Avoid personal Gmail accounts for business properties
- Use company email
- Prevents access issues when people leave 5. Document access:
- Keep spreadsheet of who has access and permission level
- Note date added and reason
- Update when changes occur
- Helpful for audits and troubleshooting 6. Be careful with Owner designation:
- Owner can delete property
- Owner can remove other owners
- Only grant to truly trusted administrators
Common GSC Pitfalls and How to Avoid Them {#common-pitfalls}
Even experienced SEOs make these mistakes. Avoid them to maximize GSC value.
Pitfall #1: Only Looking at Total Clicks
The trap: Focusing solely on total clicks as success metric. Why it's limiting:
- Clicks don't show the full picture
- Missing context of impressions, position, CTR
- Can't identify specific opportunities
- Doesn't reveal why clicks changed What to do instead: 1. Analyze click trends over time:
- Week-over-week changes
- Month-over-month growth
- Year-over-year comparison 2. Segment clicks by type:
- Branded vs non-branded queries
- Commercial vs informational queries
- Top pages vs overall distribution
- Device breakdown (mobile vs desktop) 3. Context with other metrics:
- Clicks + impressions = visibility opportunity
- Clicks + CTR = listing optimization effectiveness
- Clicks + position = ranking quality 4. Drill into what drives clicks:
- Which queries generate clicks?
- Which pages perform best?
- What content types attract clicks?
- Where are quick wins hiding?
Pitfall #2: Ignoring Impression Data
The trap: Thinking impressions don't matter because they're not clicks. Why impressions are critical: Impressions show opportunity:
- High impressions + low CTR = optimization opportunity
- Low impressions = visibility problem
- Impression trends = leading indicator Use cases: 1. Find CTR optimization targets:
Filter: Position 1-5
Sort by: Impressions (descending)
Look for: High impressions with CTR below benchmark
Action: Optimize title tags and meta descriptions
2. Identify visibility problems:
Filter: Impressions > 1000, Clicks < 10
Result: Pages with visibility but no engagement
Action: Review relevance and optimize for user intent
3. Discover brand awareness:
Filter: Branded queries
Track: Impression growth over time
Metric: Brand visibility indicator
4. Spot ranking declines early:
Compare: This month vs last month impressions
Declining impressions = early warning of ranking drops
Action: Investigate before clicks significantly decline
Pitfall #3: Not Using Date Comparisons
The trap: Looking at absolute numbers without context. Example: "We got 10,000 clicks this month!"
- Is that good? Compared to what?
- Is it growing or declining?
- How does it compare to last year (seasonality)? What to do instead: Always compare:
Common misconceptions: ❌ "I'm ranking at position 7.2"
- No – you averaged position 7.2 across all impressions
- Different users see different positions
- Personalization, location, device all affect position ❌ "My position dropped 0.3 points – disaster!"
- Small fluctuations (< 1 position) are normal noise
- Don't obsess over decimal changes
- Look for significant trends, not micro-changes ❌ "I search and see position 5, not 7!"
- Your search is personalized
- Average reflects thousands of user experiences
- Your view ≠ everyone's view What average position tells you: ✓ Trend direction:
- Position improving over time = rankings getting better
- Position declining over time = rankings deteriorating
- Stable position = maintaining rankings ✓ Rough visibility range:
- Position 1-3: Top of page 1
- Position 4-10: Lower page 1
- Position 11-20: Page 2
- Position 21+: Beyond page 2 ✓ Opportunity identification:
- Positions 11-20 = page 2 opportunities (push to page 1)
- Positions 4-6 = close to top 3 What to use instead for precise rankings:
- Dedicated rank tracking tools
- Track specific keywords from specific locations
- Daily rank snapshots
- Historical ranking data
Pitfall #5: Not Filtering Data
The trap: Analyzing generic aggregate data. Why generic data is less actionable:
- Branded queries skew everything
- Different content types have different patterns
- Device performance varies
- Opportunities hidden in aggregates Power of filtering: Example 1: Separate branded and non-branded
Branded: Query contains "YourBrand"
→ Measure brand awareness, protect brand SERPs
Non-branded: Query doesn't contain "YourBrand"
→ Measure SEO effectiveness, find opportunities
Example 2: Content type segmentation
Blog: Page URL contains "/blog/"
→ Analyze content marketing performance
Products: Page URL contains "/products/"
→ Track commercial page effectiveness
Landing pages: Page URL contains "/lp/"
→ Measure campaign performance
Example 3: Device-specific analysis
Mobile: Device = Mobile
→ Identify mobile-specific opportunities
→ Find mobile CTR problems
→ Mobile-first indexing impact
Desktop: Device = Desktop
→ Desktop-specific patterns
Example 4: Query intent filtering
Informational: Query contains "how to|what is|guide|tutorial"
Question intent: Query contains "how|what|when|where|why|who"
Commercial: Query contains "best|review|vs|compare|buy"
Transactional: Query contains "buy|purchase|order|price"
Pitfall #6: Forgetting About Data Sampling
The trap: Assuming you see all your data. GSC limitations: 1. 1,000 row limit in UI:
- Any report shows maximum 1,000 rows
- Exports also capped at 1,000 rows
- Large sites have tens of thousands of queries/pages Workaround:
- Use filters to see different segments
- Sort by different metrics
- Use GSC API for up to 25,000 rows
- Export multiple filtered segments 2. Anonymous queries:
- Low-frequency queries hidden for privacy
- Can be 10-40% of impressions
- You see aggregate count but not actual queries Workaround:
- Accept you won't see everything
- Focus on queries you can see
- Use keyword research tools to fill gaps
- Check landing pages receiving anonymous query traffic 3. 16-month data retention:
- Performance data deleted after 16 months
- Can't analyze long-term trends beyond 16 months
- Historical baseline lost Workaround:
- Export key data monthly
- Build historical database
- Use third-party tools for longer retention
- Create snapshots before data expires 4. Data processing delay:
- Most recent 1-3 days may be incomplete
- Final numbers settle after few days Workaround:
- Wait 3 days before finalizing reports
- Note data freshness when analyzing
- Don't panic over incomplete recent data
Pitfall #7: Not Acting on Data
The biggest mistake of all. The trap: Analysis paralysis – viewing reports without implementing insights. GSC is a diagnostic tool, not a dashboard:
- The value is in actions taken, not data viewed
- Every GSC session should produce insights
- Tracking metrics without improvement is wasted time Action-oriented workflow: Weekly GSC routine (30 minutes):
- Review performance trends (5 min)
- Action: Flag anomalies for investigation
- Check Index Coverage errors (5 min)
- Action: Create fix tasks for new errors
- Queries analysis (10 min)
- Action: Identify 3-5 optimization opportunities
- Pages analysis (5 min)
- Action: Note underperforming pages for content update
- Check Core Web Vitals (5 min)
- Action: Add performance issues to backlog Monthly guide (2 hours):
- Comprehensive query analysis
- Action: Build content calendar based on opportunities
- Page performance audit
- Action: Prioritize content updates
- Technical issue review
- Action: Create developer tickets for fixes
- Competitive analysis (position 2-10 queries)
- Action: Improve content to capture position 1
- Content gap identification
- Action: New content ideas from query data Connect insights to tasks:
- Every insight → Jira ticket, Asana task, or to-do item
- Assign owner and deadline
- Track implementation
- Measure results Measure impact:
- Before optimization: Note metrics
- After optimization: Measure change
- Calculate ROI of efforts
- Double down on what works Example action pipeline:
GSC Insight: "10 queries ranking positions 11-15 with 2,000+ monthly impressions each"
↓
Action: Create optimization task for each query's landing page
↓
Implementation: Improve content, optimize on-page SEO, build internal links
↓
Measurement: Track position improvement and click increase
↓
Iteration: Apply successful tactics to similar queries
[Infographic: 7 Common GSC Mistakes Checklist - printable reference]
Connecting GSC Data to Business Outcomes {#business-outcomes}
SEO success isn't measured in rankings and clicks—it's measured in revenue, leads, and business growth. GSC data means nothing if you can't connect it to business value.
From Metrics to Revenue
Calculating Traffic Value from GSC Data
Basic calculation:
- Identify organic traffic value:
GSC Clicks × Conversion Rate × Average Order Value = Organic Revenue
Example:
- GSC clicks: 10,000/month
- Conversion rate: 2%
- Average order value: $100
- Organic revenue = 10,000 × 0.02 × $100 = $20,000/month
- Calculate equivalent ad spend:
GSC Clicks × Average CPC for those keywords = Equivalent Ad Value
Example:
- GSC clicks: 10,000/month
- Average CPC: $2.50
- Equivalent ad value = 10,000 × $2.50 = $25,000/month This represents how much you'd pay in Google Ads for this traffic.
- Query-specific value:
Filter by commercial queries
→ Calculate clicks from buying-intent queries
→ Apply higher conversion rate
→ Show revenue from SEO efforts targeting commercial terms
Advanced: Export GSC data, enrich with CPC from keyword tools, calculate value per query, prioritize high-value query optimization.
Correlating Organic Traffic to Conversions
Connect GSC to Google Analytics: In GA4:
- Go to Acquisition → Google Organic Search
- See organic traffic behavior
- Track conversions by landing page
- Match landing pages to GSC pages Analysis:
High GSC clicks + High GA4 conversions = Successful SEO
High GSC clicks + Low GA4 conversions = Traffic quality issue
Low GSC clicks + High GA4 conversions = Opportunity (scale this)
Attribution:
- GSC shows first touch
- GA4 shows full journey
- Combined view = complete picture Conversion path analysis:
- Identify top converting landing pages (GA4)
- Check GSC performance for these pages
- Optimize to increase clicks to high-converting pages
- Result: More traffic to pages that convert = more revenue
Building ROI Models from Search Data
SEO ROI calculation:
ROI = (Organic Revenue - SEO Cost) / SEO Cost × 100
Example:
- Organic revenue: $20,000/month
- SEO cost: $5,000/month
- ROI = ($20,000 - $5,000) / $5,000 × 100 = 300% ROI Forecasting model: Current state (GSC):
- 10,000 clicks/month
- Average position: 6.5 Scenario planning:
If average position improves to 4.0:
→ CTR increases from 5% to 8% (historical data)
→ With same impressions, clicks increase 60%
→ 10,000 → 16,000 clicks
→ Revenue increases $20,000 → $32,000
→ Additional revenue: $12,000/month
Investment justification:
- Improvement effort cost: $10,000
- Monthly revenue increase: $12,000
- Payback period: <1 month
- Annual impact: $144,000 [Chart: Traffic to revenue calculation example with visual flow]
GSC for Different Business Goals
E-Commerce: Product Discovery and Conversion
Key metrics:
- Clicks to product pages
- Impressions for product-related queries
- CTR on product listings
- Position for buying-intent queries GSC optimization strategies: 1. Product page visibility:
Filter: Pages containing "/product/"
Sort by: Impressions
Analyze: Which products have visibility but low clicks?
Action: Optimize product titles, descriptions, images for CTR
2. Category page performance:
Filter: Pages containing "/category/"
Identify: Categories ranking for valuable queries
Action: Strengthen category pages with content, internal links
3. Buying-intent queries:
Filter: Queries containing "buy|price|cheap|best|review"
Track: Position and clicks
Action: Optimize for commercial queries with product content
4. Rich results impact:
Enable: Product schema (price, availability, ratings)
Measure: CTR lift in Search Appearance report
Result: 30-50% CTR improvement typical
B2B SaaS: Lead Generation Tracking
Key metrics:
- Clicks to demo/trial pages
- Impressions for solution-oriented queries
- Position for comparison queries
- CTR on content targeting decision-makers GSC optimization strategies: 1. Solution-oriented content:
Filter: Queries containing "how to|solution|fix|improve|increase"
Identify: Queries showing pain points
Action: Create content addressing these problems, linking to product
2. Comparison and alternative queries:
Filter: Queries containing "vs|versus|alternative|competitor"
Track: Position for competitive queries
Action: Create comparison content, capture consideration-stage searches
3. Decision-maker keywords:
Filter: Queries containing role terms "CTO|manager|director|lead"
Analyze: Content resonating with decision-makers
Action: Expand content for buyer personas
4. Bottom-funnel tracking:
Filter: Pages containing "/demo|/trial|/pricing"
Measure: Click growth to conversion pages
Connect: To lead volume in CRM
Result: Direct GSC → lead correlation
Publishers: Content Engagement and Monetization
Key metrics:
- Clicks to articles
- Impressions for trending topics
- CTR on headline variations
- Position for evergreen content GSC optimization strategies: 1. Trending topic identification:
Date range: Last 7 days
Sort by: Impressions growth
Identify: Emerging queries with increasing search volume
Action: Quick-publish content on trending topics
2. Evergreen content performance:
Filter: Articles published >1 year ago
Sort by: Clicks
Identify: Sustained traffic performers
Action: Update, expand, maintain these assets
3. Headline optimization:
Analyze: CTR by article topic
Compare: High vs low CTR articles
Test: Different headline formulas
Optimize: Titles for click appeal
4. Seasonal content planning:
Year-over-year comparison
Identify: Seasonal spikes (last year's data)
Action: Prepare content 1-2 months before seasonal peak
Result: Capture seasonal traffic growth
Local Businesses: Geographic Performance
Key metrics:
- Clicks from target geographic area
- Impressions for "near me" queries
- Position for local service queries
- CTR on location-specific results GSC optimization strategies: 1. Local query targeting:
Filter: Queries containing city/region names
Track: Local query performance
Action: Optimize for geo-modified keywords
2. "Near me" optimization:
Filter: Queries containing "near me"
Measure: Mobile performance (most "near me" is mobile)
Action: Ensure mobile-friendly, local signals strong
3. Service area expansion:
Countries report: Review geographic distribution
Identify: Nearby areas with impressions but few clicks
Action: Create location pages for service expansion areas
4. Local pack tracking:
Note: GSC doesn't show map pack separately
Workaround: Track branded searches + location
Indicator: Local visibility health
Communicating GSC Insights to Stakeholders
Different stakeholders care about different metrics. Tailor communication accordingly.
Executive Dashboards
What executives care about:
- Revenue impact
- ROI
- Competitive position
- Growth trends
- Risk Dashboard elements: 1. Traffic & revenue trend:
- Line graph: Monthly organic clicks overlaid with revenue
- YoY comparison showing growth percentage
- Projection trend line 2. Business impact summary:
Organic traffic value: $45,000/month (equivalent ad spend)
Conversion revenue: $28,000/month
YoY growth: +32%
Current ROI: 460%
3. Key wins:
- "Captured position 1 for '[high-value query]' — driving 450 clicks/month"
- "Fixed 125 indexing errors — recovered 12% of indexed pages"
- "Improved page speed — Core Web Vitals now 94% Good URLs" 4. Risk alerts:
- Manual actions: None ✓
- Security issues: None ✓
- Critical errors: 3 [Dashboard mockup: Executive-friendly GSC summary]
Marketing Team Metrics
What marketing cares about:
- Content performance
- Channel contribution
- Campaign effectiveness
- Audience insights Marketing-focused metrics: 1. Content ROI:
Top performing content (by clicks)
Content gaps
Underperforming content (update candidates)
Seasonal content opportunities
2. Audience insights:
Top queries: What language/terms does audience use?
Question queries: What does audience want to know?
Geographic distribution: Where is audience located?
Device preference: Mobile vs desktop behavior
3. Channel comparison:
Organic search clicks: [from GSC]
Paid search clicks: [from Google Ads]
Social traffic: [from GA4]
→ Show organic search contribution to overall digital marketing
SEO Team Technical Metrics
What SEO practitioners care about:
- Detailed technical data
- Indexing status
- On-page optimization opportunities
- Link profile
- Algorithm update impacts Technical dashboard: 1. Indexing health:
Valid pages: 45,234 (↑ 2.3%)
Errors: 234 (↓ 45%)
Excluded: 12,456
Top errors: Server errors (89), 404s (67), Soft 404s (45)
2. Crawl efficiency:
Crawl requests: 125,000/day
Response time: 245ms avg
Crawl errors: 2.1%
3. Performance guide:
Top opportunity queries
Declining queries (position loss > 3 positions)
CTR underperformers
Cannibalization issues (multiple pages same query)
4. Core Web Vitals technical:
LCP issues: 234 URLs — primary cause: unoptimized images
INP issues: 89 URLs — primary cause: third-party scripts
CLS issues: 145 URLs — primary cause: missing dimensions
Different Stakeholder Needs
| Stakeholder | Frequency | Focus | Format |
|---|---|---|---|
| Executive | Monthly | Revenue, ROI, growth, risk | 1-page summary |
| Marketing | Weekly | Content performance, opportunities | Dashboard + insights |
| SEO Team | Daily/Weekly | Technical details, optimization tasks | Full GSC access |
| Client | Monthly | Progress, wins, next steps | Narrative report |
| Board | Quarterly | Strategic impact, competitive position | Presentation |
| Storytelling with data: | |||
| Instead of: "We got 15,000 clicks this month" | |||
| Tell the story: | |||
| "Our organic search drove 15,000 website visits this month—a 28% increase year-over-year. This traffic generated $32,000 in revenue at a cost of just $4,000 in SEO efforts, delivering an 800% ROI. For comparison, generating this traffic through paid search would cost approximately $38,000. Our top win was capturing the featured snippet for '[valuable query],' which now drives 1,200 monthly clicks that convert at 4.5%—double our site average." | |||
| [Link to: SEO Reporting for Stakeholders: Turning Data Into Business Impact - referenced from brief] |
Advanced GSC Analysis Techniques {#advanced-analysis}
Ready to extract maximum value from GSC? These advanced techniques separate power users from casual observers. When you identify issues in your data, our comprehensive guide on SEO performance analysis and how to diagnose and fix traffic problems provides systematic frameworks for troubleshooting.
Exporting and Analyzing in Google Sheets
Why export to Google Sheets:
- Overcome 1,000-row limit
- Build custom dashboards
- Perform advanced analysis
- Create automated reporting
- Archive historical data
Basic Export Process
How to export:
- In any GSC report, click Export button
- Choose "Download to Google Sheets" or "Download CSV"
- Data exports to spreadsheet Limitations:
- 1,000 row max per export
- Must filter/segment to see more data
Overcoming the 1,000-Row Limit
Strategy 1: Multiple filtered exports
Export 1: Queries containing "how to"
Export 2: Queries containing "what is"
Export 3: Queries containing "best"
Export 4: Branded queries
Export 5: Remaining queries (exclude all above)
→ Combine in master sheet for complete picture
Strategy 2: Date-based segmentation
Export Week 1: Jan 1-7
Export Week 2: Jan 8-14
Export Week 3: Jan 15-21
Export Week 4: Jan 22-31
→ Combine for monthly comprehensive data
Strategy 3: Page-based exports
Export 1: Pages containing "/blog/"
Export 2: Pages containing "/products/"
Export 3: Pages containing "/services/"
→ Full data for each content type
Creating Custom Dashboards
Essential dashboard components: 1. Traffic overview:
=QUERY(Data!A:F, "SELECT A, SUM(B), SUM(C), AVG(D), AVG(E) GROUP BY A ORDER BY SUM(B) DESC")
Shows total clicks, impressions, average CTR, average position by date 2. Top opportunities (high impression, low CTR):
=FILTER(Data!A:F, Data!C>1000, Data!D<0.05, Data!E<10)
Filters queries with 1,000+ impressions, <5% CTR, position <10 3. Page 2 opportunities:
=FILTER(Data!A:F, Data!E>=11, Data!E<=20, Data!C>100)
Queries ranking positions 11-20 with significant impressions 4. Year-over-year growth:
=(ThisMonth!B2-LastYear!B2)/LastYear!B2
Calculates YoY growth percentage Dashboard visualization:
- Line charts for trends
- Bar charts for comparisons
- Conditional formatting for opportunities
- Sparklines for micro trends
Formulas for Deeper Analysis
CTR benchmark comparison:
=IF(E2="1", IF(D2<0.30, "Low CTR", "Good"),
IF(E2<="3", IF(D2<0.15, "Low CTR", "Good"),
IF(E2<="10", IF(D2<0.05, "Low CTR", "Good"), "Page 2")))
Flags queries with below-benchmark CTR for their position Impression share estimation:
=C2/(D2+0.001)
Rough estimate of total search volume (impressions / CTR) Traffic potential:
=(C2 * BenchmarkCTR) - B2
Potential additional clicks if you achieved benchmark CTR Revenue calculation:
=B2 * ConversionRate * AverageOrderValue
Estimated revenue from organic clicks [Screenshot: Google Sheets dashboard example with multiple visualizations]
Combining GSC with Other Data Sources
Maximum insights come from combining GSC with complementary data.
GSC + Google Analytics 4
What each provides:
- GSC: Pre-click data
- GA4: Post-click data Combined analysis: 1. Landing page conversion correlation:
GSC Landing Pages (sorted by clicks)
+ GA4 Conversion data
= Which pages drive both traffic AND conversions
2. Query-to-conversion mapping:
GSC Queries
+ GA4 Conversions (filtered by organic source)
= Which search terms lead to conversions
3. Engagement quality:
GSC Pages with high clicks
+ GA4 Engagement rate & bounce rate
= Traffic quality assessment
How to combine:
- Export GSC landing page data
- Export GA4 landing page data (organic traffic only)
- Use VLOOKUP or JOIN to match pages
- Analyze combined metrics
GSC + Keyword Research Tools
What keyword tools add:
- Search volume estimates
- Keyword difficulty scores
- CPC values
- Related keyword suggestions
- Competitive intelligence Combined workflow: 1. Export GSC queries 2. Enrich with keyword data:
GSC Query | GSC Impressions | Keyword Tool Volume | CPC | Difficulty
"seo tools" | 5,000 | 15,000 | $4.50 | 65
3. Calculate metrics:
- Impression share: GSC Impressions / Tool Volume = Market share
- Traffic value: GSC Clicks × CPC = Equivalent ad spend
- Opportunity score: (Volume × CPC) / Difficulty = Prioritization 4. Prioritize: High volume + Low difficulty + High CPC = Target these first
GSC + Rank Tracking Tools
What rank trackers add:
- Precise daily rankings for specific keywords
- Competitor ranking data
- Local ranking variations
- SERP feature tracking Combined insights: GSC shows:
- Average position trends (directional)
- Actual clicks received
- Impression volume Rank tracker shows:
- Exact ranking on specific date
- Competitor positions
- Ranking in different locations
- SERP feature presence Use together:
- GSC for opportunity identification
- Rank tracker for competitive analysis
- GSC for impact measurement
GSC + Heatmaps/Session Recording
What heatmaps/session recording add:
- User behavior on landing pages
- Click patterns
- Scroll depth
- Friction points Combined workflow: 1. Identify high-traffic, low-converting pages (GSC + GA4) 2. Install heatmap/session recording on those pages 3. Analyze:
- Are users engaging with content?
- Where do they drop off?
- Are CTAs visible?
- What's causing exits? 4. Optimize based on findings 5. Measure in GSC:
- Did engagement improvements affect dwell time signals?
- Did CTR improve? [Link to: GSC Filters and Comparisons: A Complete Tutorial (Cluster #3)]
Regex Filtering for Power Users
Regular expressions unlock powerful filtering capabilities in GSC.
Basic Regex Patterns
Literal match:
blog
Matches pages containing "blog" OR operator:
blog|news|articles
Matches pages containing blog OR news OR articles Wildcard:
product.*review
Matches "product review", "product-review", "product-best-review", etc. Start of string:
^https://www.example.com/blog/
Matches only URLs starting with exact string End of string:
\.pdf$
Matches URLs ending in .pdf Character class:
[0-9]+
Matches any number sequence (useful for product IDs, dates)
Use Cases for Regex in GSC
Filter all blog posts:
Custom regex: /blog/[^/]+/?$
Matches /blog/post-title/ but not /blog/category/post-title/ Filter specific subdirectories:
/(products|services|solutions)/
Matches any of these directories Exclude URL parameters:
^[^\?]+$
Matches URLs without ? (no parameters) Filter by date pattern in URL:
/202[456]/
Matches URLs containing 2024, 2025, or 2026 Product pages only (exclude categories):
/product/[^/]+/?$
Matches single-level product pages Question-based queries:
^(how|what|when|where|why|who)
Matches queries starting with question words
Common Regex Examples for SEO
Branded queries:
(?i)(brand|company|product name)
(?i) makes it case-insensitive Commercial intent:
(?i)(buy|purchase|price|cost|cheap|best|review|vs|versus)
Local queries:
(?i)(near me|in [city]|[city] [service])
Long-tail queries (4+ words):
^\w+\s+\w+\s+\w+\s+\w+
Exclude branded:
^(?!.*(brand|company)).*$
Matches queries NOT containing brand/company Tutorial content:
(?i)(how to|guide|tutorial|step by step|learn)
[Screenshot: Regex filter example in GSC showing pattern and results] [Code snippet: Regex cheat sheet for common GSC filters]
API Access for Large Sites
For sites exceeding 1,000 queries/pages, the GSC API provides access to more data.
When to Use the GSC API
You need the API if:
- Site has >1,000 queries regularly
- Large e-commerce site with thousands of products
- Need automated daily exports
- Building custom reporting dashboards
- Integrating GSC data with other systems
- Agency managing multiple client properties You don't need the API if:
- Small site
- Manual monthly exports are sufficient
- Can work within 1,000-row limit via filtering
Setting Up API Access
High-level process: 1. Enable GSC API in Google Cloud Console
- Go to console.cloud.google.com
- Create project or select existing
- Enable Search Console API 2. Create credentials
- OAuth 2.0 client ID
- Or service account 3. Install client library
pip install google-api-python-client google-auth
4. Authenticate and connect
from googleapiclient.discovery import build
from google.oauth2 import service_account
credentials = service_account.Credentials.from_service_account_file(
'credentials.json',
scopes=['https://www.googleapis.com/auth/webmasters.readonly']
)
service = build('searchconsole', 'v1', credentials=credentials)
5. Query data
request = {
'startDate': '2026-01-01',
'endDate': '2026-01-31',
'dimensions': ['query'],
'rowLimit': 25000 # API allows up to 25,000 rows
}
response = service.searchanalytics().query(
siteUrl='https://www.example.com/',
body=request
).execute()
Benefits of API Access
1. Higher row limits:
- UI: 1,000 rows
- API: 25,000 rows per request
- Can make multiple requests for even more data 2. Automation:
- Daily exports
- Scheduled reports
- Automated alerting 3. Custom aggregations:
- Combine dimensions
- More flexible filtering
- Complex calculations 4. Integration:
- Push data to data warehouses
- Feed into BI tools
- Combine with other data sources programmatically
Tools That Use GSC API
Looker Studio (formerly Data Studio):
- Free Google tool
- Native GSC connector
- Build custom dashboards
- Automated updates
- More than 1,000 rows
- Combine with GA4, Google Ads, etc. Third-party SEO tools:
- Ahrefs: GSC integration for enriched data
- Semrush: Combines GSC with their data
- SE Ranking: GSC reporting features
- AgencyAnalytics: Client reporting with GSC data Custom solutions:
- Python scripts for automated exports
- Google Sheets with Apps Script
- Data warehouse integration (BigQuery, Snowflake)
- Custom internal dashboards [Code snippet: Basic Python script for GSC API data export]
GSC Best Practices Checklist {#best-practices-checklist}
Consistency beats intensity. Follow this schedule to maintain GSC mastery and catch issues early.
Daily (5 minutes)
Quick health check: ☐ Review Performance Report total clicks
- Significant drop (>20%)? Investigate immediately
- Unusual spike? Verify it's legitimate traffic ☐ Check Manual Actions section
- New penalties? Address urgently ☐ Check Security Issues section
- New alerts? Critical immediate action required When to spend more time:
- Traffic drop >30%: guide needed
- Security issue or manual action: Drop everything, fix immediately
- Otherwise: Move on, comprehensive review is weekly
Weekly (30-45 minutes)
Monday morning routine: ☐ Performance trends (10 min)
- Compare last 7 days to previous 7 days
- Note any anomalies
- Check top 10 queries for position changes
- Review top 10 pages for click changes ☐ Index Coverage review (10 min)
- Check error count: Increasing or decreasing?
- Review new errors (if any)
- Verify recent fixes are validated
- Monitor "Crawled - currently not indexed" count ☐ Query opportunity analysis (15 min)
- Filter position 4-15
- Sort by impressions
- Identify 3-5 optimization opportunities
- Add to content calendar/task list ☐ Core Web Vitals spot check (5 min)
- Note percentage of Good URLs
- Check if any significant changes
- If degrading, add to backlog for investigation Output:
- 3-5 actionable tasks for the week
- Any urgent issues flagged
- Performance summary for stakeholders (if needed)
Monthly (2-3 hours)
First Monday of month: ☐ Comprehensive Performance Report analysis (45 min)
- Month-over-month comparison
- Year-over-year comparison
- Device performance analysis
- Country performance analysis
- Search Appearance analysis (if applicable)
- Export top 1,000 queries and pages for archival ☐ Query guide (30 min)
- Branded vs non-branded performance
- Question queries analysis
- Commercial intent queries analysis
- New query discoveries
- Lost queries ☐ Page audit (30 min)
- Top performers: What's working? Replicate
- Declining pages: What changed? Fix
- Underperformers: High impressions, low clicks → Optimize
- New pages: Are they getting indexed and ranked? ☐ Technical review (30 min)
- Index Coverage guide
- Crawl Stats patterns
- Mobile Usability issues
- Sitemap status
- Any validation requests pending? ☐ Competitive content analysis (30 min)
- Queries ranking position 2-10
- What would it take to reach #1?
- Content gap opportunities
- SERP feature opportunities Output:
- Monthly report for stakeholders
- Content calendar updates
- Technical tasks for development
- 10-20 optimization tasks prioritized
Quarterly (4-6 hours)
First week of quarter: ☐ Year-over-year strategic analysis (60 min)
- Traffic trends
- Seasonal patterns
- Algorithm update impacts
- Content strategy effectiveness
- Technical improvements impact ☐ Comprehensive content audit (90 min)
- All pages with >100 clicks: Update or maintain?
- Pages with high impressions, zero clicks: Fix or remove?
- Cannibalization analysis: Multiple pages same query?
- Opportunity content: Queries without dedicated pages? ☐ Technical SEO audit (60 min)
- Index coverage trends
- Crawl efficiency analysis
- Core Web Vitals progress
- Mobile usability status
- Structured data performance
- Link profile analysis ☐ Goal setting for next quarter (30 min)
- Traffic goals
- Priority optimizations
- Content plan
- Technical improvements roadmap ☐ Process improvement (30 min)
- Is weekly routine working?
- What analysis should be automated?
- Are there gaps in monitoring?
- Tool evaluation Output:
- Quarterly executive report
- Q goals and KPIs
- Resource allocation plan
- Updated SEO strategy
Annual (8-12 hours)
January (planning for year): ☐ Comprehensive year-in-review (2-3 hours)
- Full year performance vs goals
- Major wins and losses
- Algorithm update impacts
- Content strategy ROI
- Technical improvements ROI
- Competitive landscape shifts ☐ Property management audit (1 hour)
- Verify all properties correctly configured
- User access audit
- Verification methods still working?
- Consider domain property migration ☐ Data export and archiving (1 hour)
- Export all historical data before 16-month expiry
- Archive to long-term storage
- Validate exports are complete
- Document export process for next year ☐ Strategy development (4-6 hours)
- Annual SEO goals aligned with business objectives
- Content strategy for year
- Technical roadmap
- Resource needs
- Tool stack evaluation
- Competitive positioning strategy ☐ Training and documentation (2 hours)
- Update internal GSC documentation
- Train team on new features
- Document processes and workflows
- Create templates for reports Output:
- Annual SEO strategy document
- Budget and resource plan
- Training materials
- Baseline for next year's measurement
Downloadable Checklist
Create a simple checklist you can refer to: Daily Quick Check (5 min)
- Clicks trend (last 7d vs prev 7d)
- Manual actions
- Security issues Weekly Analysis (30-45 min)
- Performance trends
- Index coverage errors
- 3-5 query opportunities identified
- Core Web Vitals status Monthly guide (2-3 hrs)
- MoM and YoY comparison
- Query analysis
- Page audit
- Technical review
- Competitive analysis
- Monthly report created Quarterly Strategy (4-6 hrs)
- Strategic YoY analysis
- Content audit
- Technical audit
- Goal setting for next quarter
- Executive report delivered Annual Planning (8-12 hrs)
- Year-in-review
- Property management audit
- Data archiving
- Annual strategy
- Team training [Infographic: Printable one-page GSC maintenance schedule]
Conclusion & Next Steps {#conclusion}
Google Search Console is the foundation of effective, data-driven SEO. the interface appears simple but true mastery comes from understanding what your data means, connecting metrics to business outcomes, and—, —taking action on insights.
Key Takeaways
1. GSC is the foundation of data-driven SEO Every SEO strategy should start with GSC data. It shows you exactly how Google sees your site and how searchers interact with your presence in search results. Ignore GSC at your peril. 2. Regular monitoring beats occasional deep dives The SEOs who get the most value from GSC are those who check it consistently. Weekly 30-minute sessions catch issues early and identify opportunities before competitors. Annual deep dives miss critical changes happening in real-time. 3. Action matters more than analysis You can be the world's best GSC data analyst, but if you don't implement insights, you've gained nothing. Every GSC session should produce actionable tasks. Analysis without action is procrastination disguised as work. To transform your GSC insights into concrete optimization strategies, see our complete guide on turning data into action with evidence-based SEO. 4. Your GSC data tells a story—learn to read it Behind every metric is a story about your content, your audience, and your search presence:
- Declining impressions tell a story of lost visibility
- High impressions with low clicks tell a story of poor CTR optimization
- "Crawled - currently not indexed" tells a story of content quality issues
- Position trends tell a story of competitive dynamics read between the lines and understand the narrative your data reveals. 5. Context is everything No GSC metric means anything in isolation:
- 10,000 clicks: Good or bad? Depends on last month, last year, your goals
- Position 7: Problem or success? Depends on where you started, competition, business impact
- 50 index errors: Crisis or noise? Depends on total pages, error types, priority Always add context through comparisons, segmentation, and connection to business outcomes.
Your Next Steps
Baseline your current state**
- Export last 28 days performance data
- Note total clicks, impressions, average CTR, average position
- Count index errors
- Check Core Web Vitals status
- Document for comparison 3. Identify one quick win
- Find query ranking position 11-15 with significant impressions
- OR find page with high impressions, low CTR at good position
- OR fix highest-priority index error
- Implement improvement this week
This Month: Build Momentum
1. Establish weekly GSC routine
- Set recurring 30-minute Monday morning meeting with yourself
- Follow weekly checklist from Best Practices section
- Create task list from each session
- Track what you implement 2. Set up custom dashboard (optional but valuable)
- Export query and page data
- Build Google Sheets tracker
- Create visualizations for key metrics
- Use for monthly reporting 3. Complete first comprehensive audit
- Work through Monthly guide checklist
- Identify 10-20 optimization opportunities
- Prioritize based on impact vs effort
- Schedule implementation
This Quarter: Scale Impact
1. Integrate GSC into content workflow
- Use query data to inform content calendar
- Track new content indexing and performance
- Identify content refresh candidates
- Measure content ROI 2. Connect GSC to business metrics
- Calculate organic traffic value
- Correlate GSC pages with GA4 conversions
- Build ROI model
- Present business impact to stakeholders 3. Level up analysis
- Learn regex filtering
- Explore API access (if needed)
- Build automated reports
- Refine and optimize your routine
Related Guides
You now have the complete knowledge to become a GSC power user. The only thing standing between you and SEO success driven by GSC insights is implementation. Start with your weekly routine. Master the Performance Report. Fix your index errors. Optimize your underperforming pages. Track your progress. In six months, you'll look back amazed at how much you've improved your search presence—all from the free data Google provides in Search Console. The data is there. The opportunity is there. Now it's time to act.
Take Your GSC Analysis Further
Ready to automate your Google Search Console insights and save hours every week? Our platform connects directly to your GSC account and automatically identifies opportunities, tracks trends, and alerts you to issues—giving you the insights from this guide without the manual work. Start Your Free Trial or Download the GSC Best Practices Checklist (PDF)
About This Guide This comprehensive guide was last updated January 21, 2026. Google Search Console features and interfaces change over time. we strive to keep this guide current but some screenshots and specific UI elements may differ from your current GSC experience. The core principles and strategies remain valid regardless of interface changes. Found this guide helpful? Share it with your team or bookmark for future reference. SEO success is a marathon, not a sprint—and GSC is your most reliable training data.
Meta Information:
- Word Count: ~9,500 words
- Reading Time: ~35 minutes
- Last Updated: January 21, 2026
- Related Topics: SEO, Google Analytics, Technical SEO, Content Optimization, Performance Monitoring Keywords: Google Search Console guide, GSC tutorial, Search Console analysis, how to use Google Search Console, GSC complete guide, Search Console for SEO, GSC Performance Report, Google Search Console optimization, Search Console best practices Internal Links: 20+ links to related cluster content External Resources: Google Search Console, PageSpeed Insights, Schema.org, Web.dev